I recently shared my tips on SEO for Bloggers and while that’s one subject that many bloggers are frightened to death of, there is another that many bloggers fear almost just as much. Google Analytics is one of those things that most bloggers know they need but once they have it, have no idea what to do with it. It’s a beast of a thing and can be quite intimidating to the uninitiated so it’s perfectly understandable. However, even having some basic knowledge of Google Analytics as a blogger can be a good thing and I’m going to tell you why.

The thing is, that analysing the data that GA collects about your blog can be incredibly valuable. Beyond telling you how much traffic you’re getting month to month, it’ll also give you a good idea of who is visiting, where they are coming from, what information they like, what they don’t like and how well your site is actually attracting the kind of people you want to read your blog.
Remember, Google Analytics has been created for all kinds of websites. So whether it’s a huge global corporation, an independent e-commerce site or well, a blogger, there’s information there for everyone. The good news is that not all of it will apply to you so you don’t actually have to understand every last thing about it for it to work for you. You just need to know what parts are important and what you can ignore.
In today’s post, I thought I’d share a few ways that I use Google Analytics to analyse the data on my blog and how, in turn, I can turn that knowledge into further growth. First things first, if you haven’t actually installed Google Analytics on your blog, you’ll want to do that straight away. It’s not that difficult and you will need a Gmail account to set it up but there are so many tutorials online and it really depends on what platform and theme you are using so I won’t cover that in this post. Just Google [The name of your platform (ie., WordPress, SquareSpace, etc)] + How to Install Google Analytics. Once it’s installed, then you’ll want to come back here. Bear in mind it won’t start collecting data until after it’s installed and then it’ll start to track your site from that point forward.
Despite the sheer volume of information on Google Analytics, there are three areas that you’ll want to concentrate on as a blogger. The others are helpful but really these are the most important which you’ll see on the dashboard in the left-hand column: Audience, Aquisition and Behaviour. We’re going to ignore the rest of the options and we’re going to delve into each of those three sections and just concentrate on the data that will be most important to your blog. Yep, feel free to ignore everything else on GA aside from these (obviously other areas may be helpful in time but we’re starting with the basics here!).
Audience > Overview
Now Google Analytics defaults to showing a one-week period but for the purposes of getting a better overview, you’ll likely want to regularly look at data over the course of a month instead. So the first thing we’ll want to do is change the period of time that GA is showing you.
If you click Audience and then Overview in the left-hand column, you’ll see something that looks like this (obviously everyone’s numbers will be different):
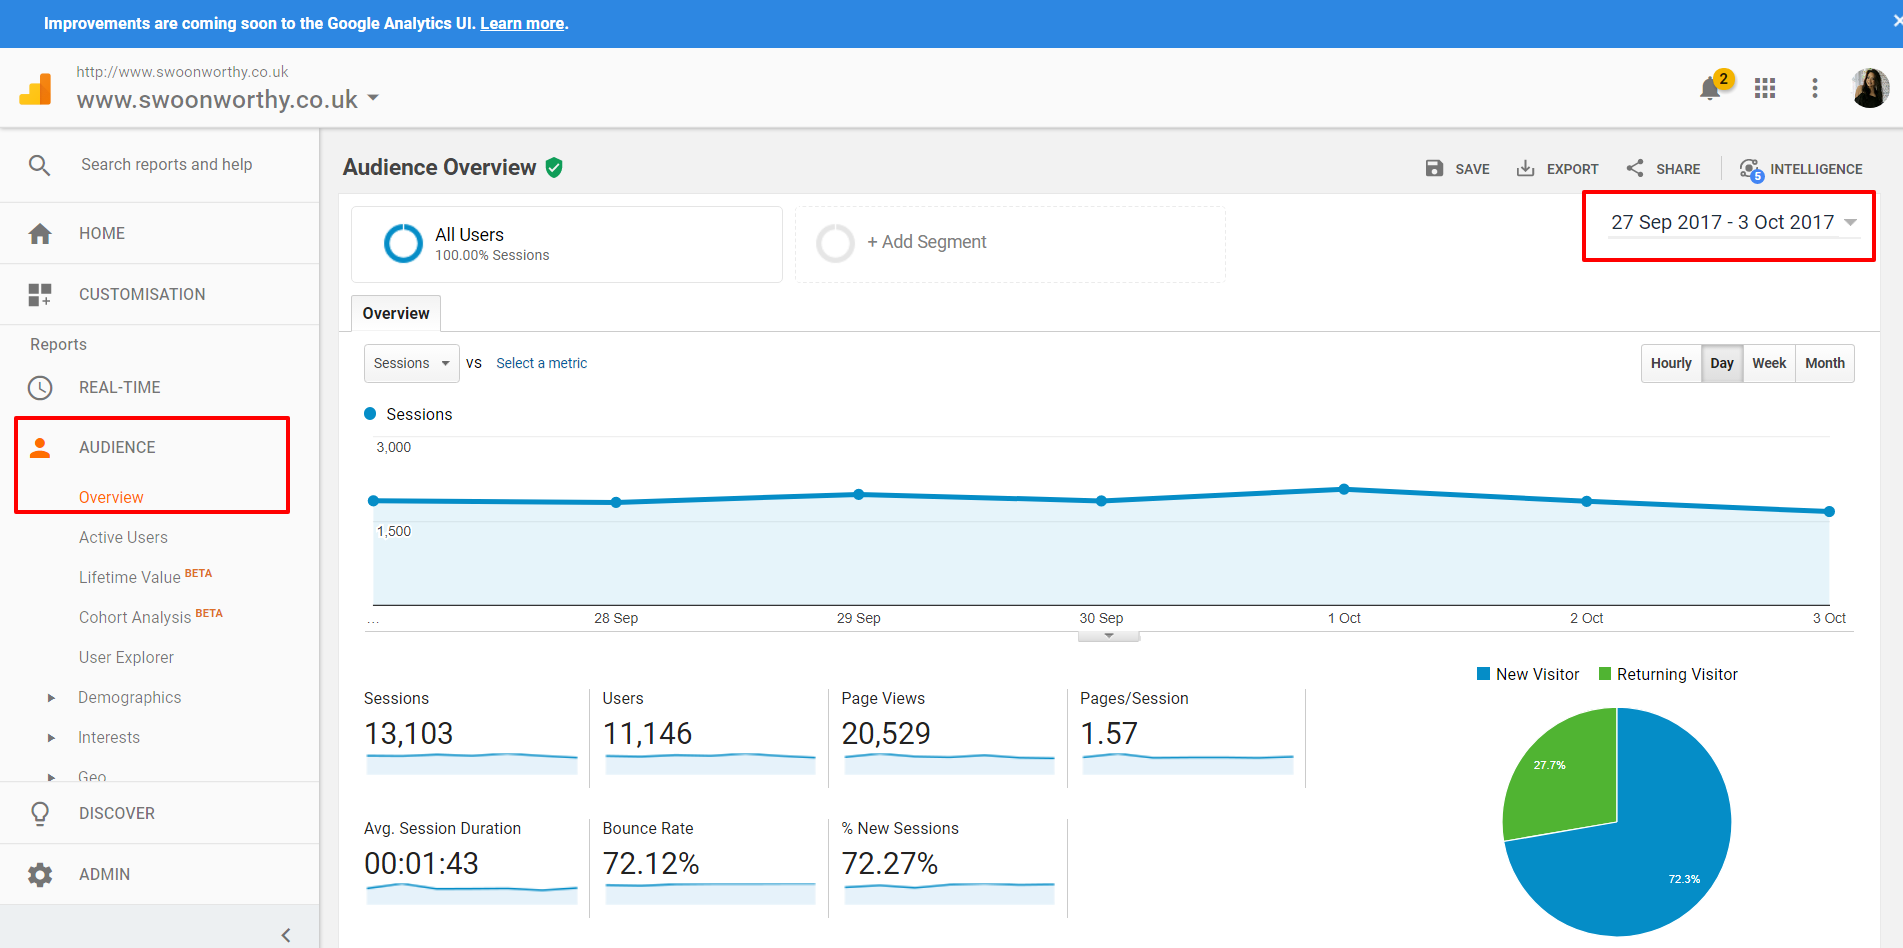
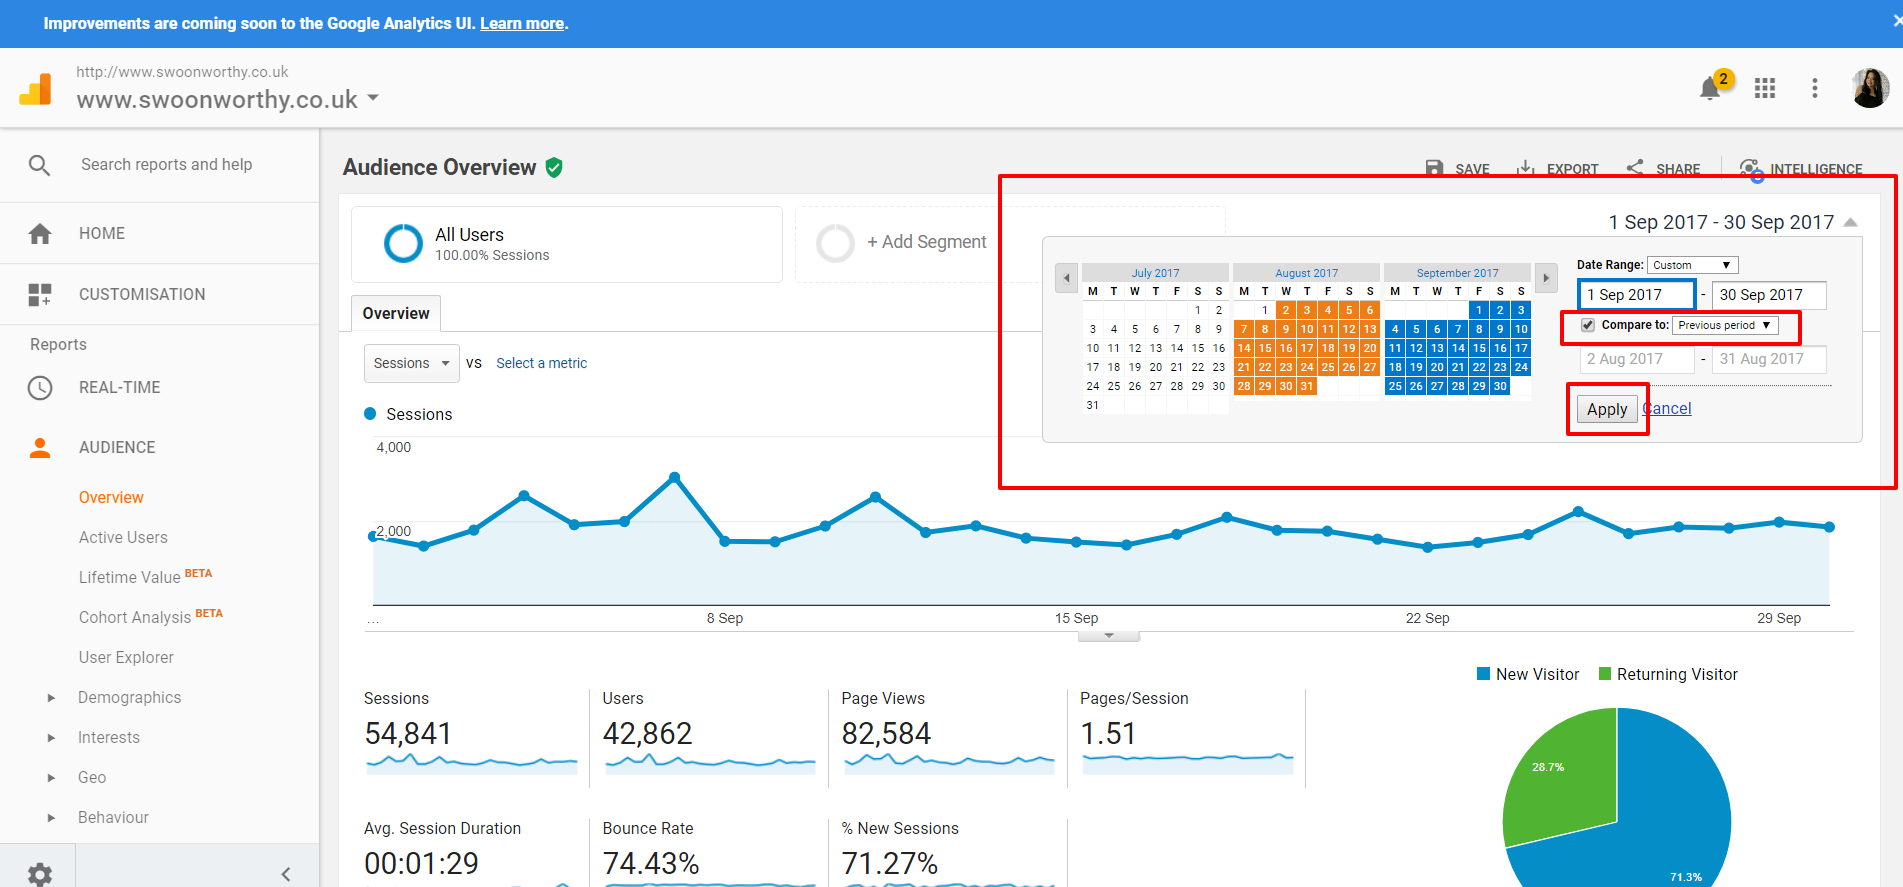
You’ll see the timeline in the upper right corner of the graph so it’s here you’ll want to change that to a one-month period. As it’s early October, I’m going to change mine from the 1st to the 30th September 2017. Now, everything we look at will be for that period of time. Click on that little dropdown arrow to view the calendar.
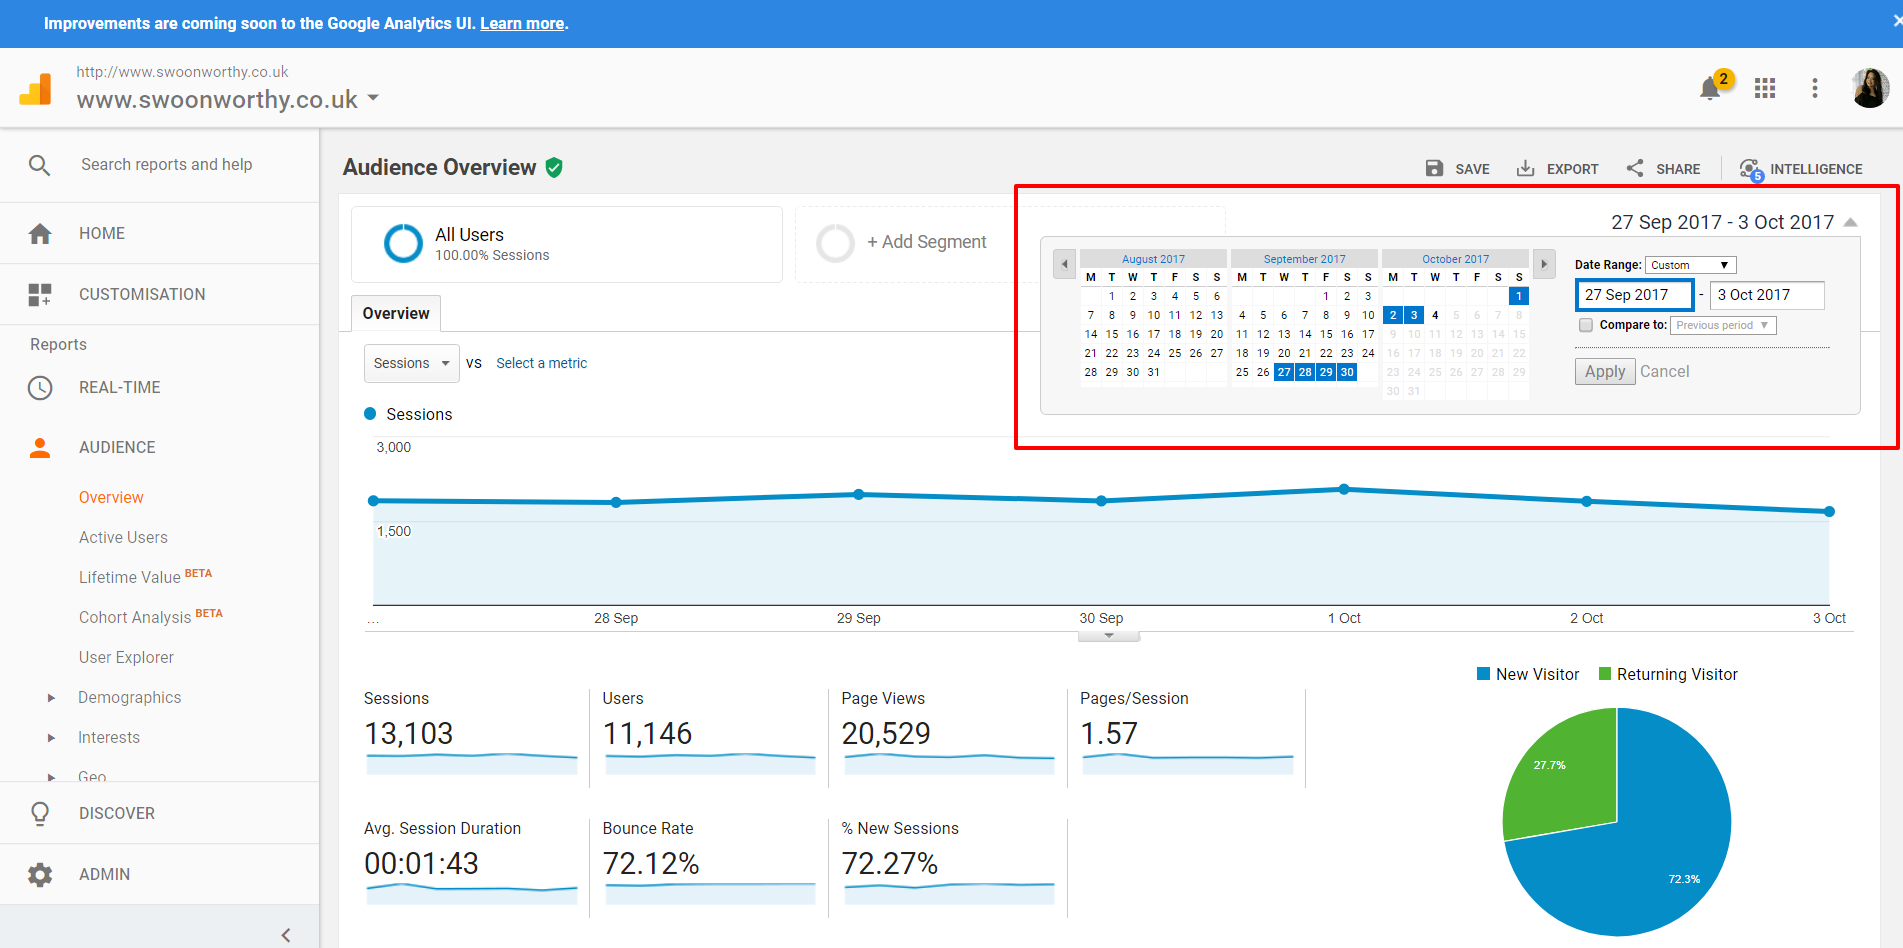
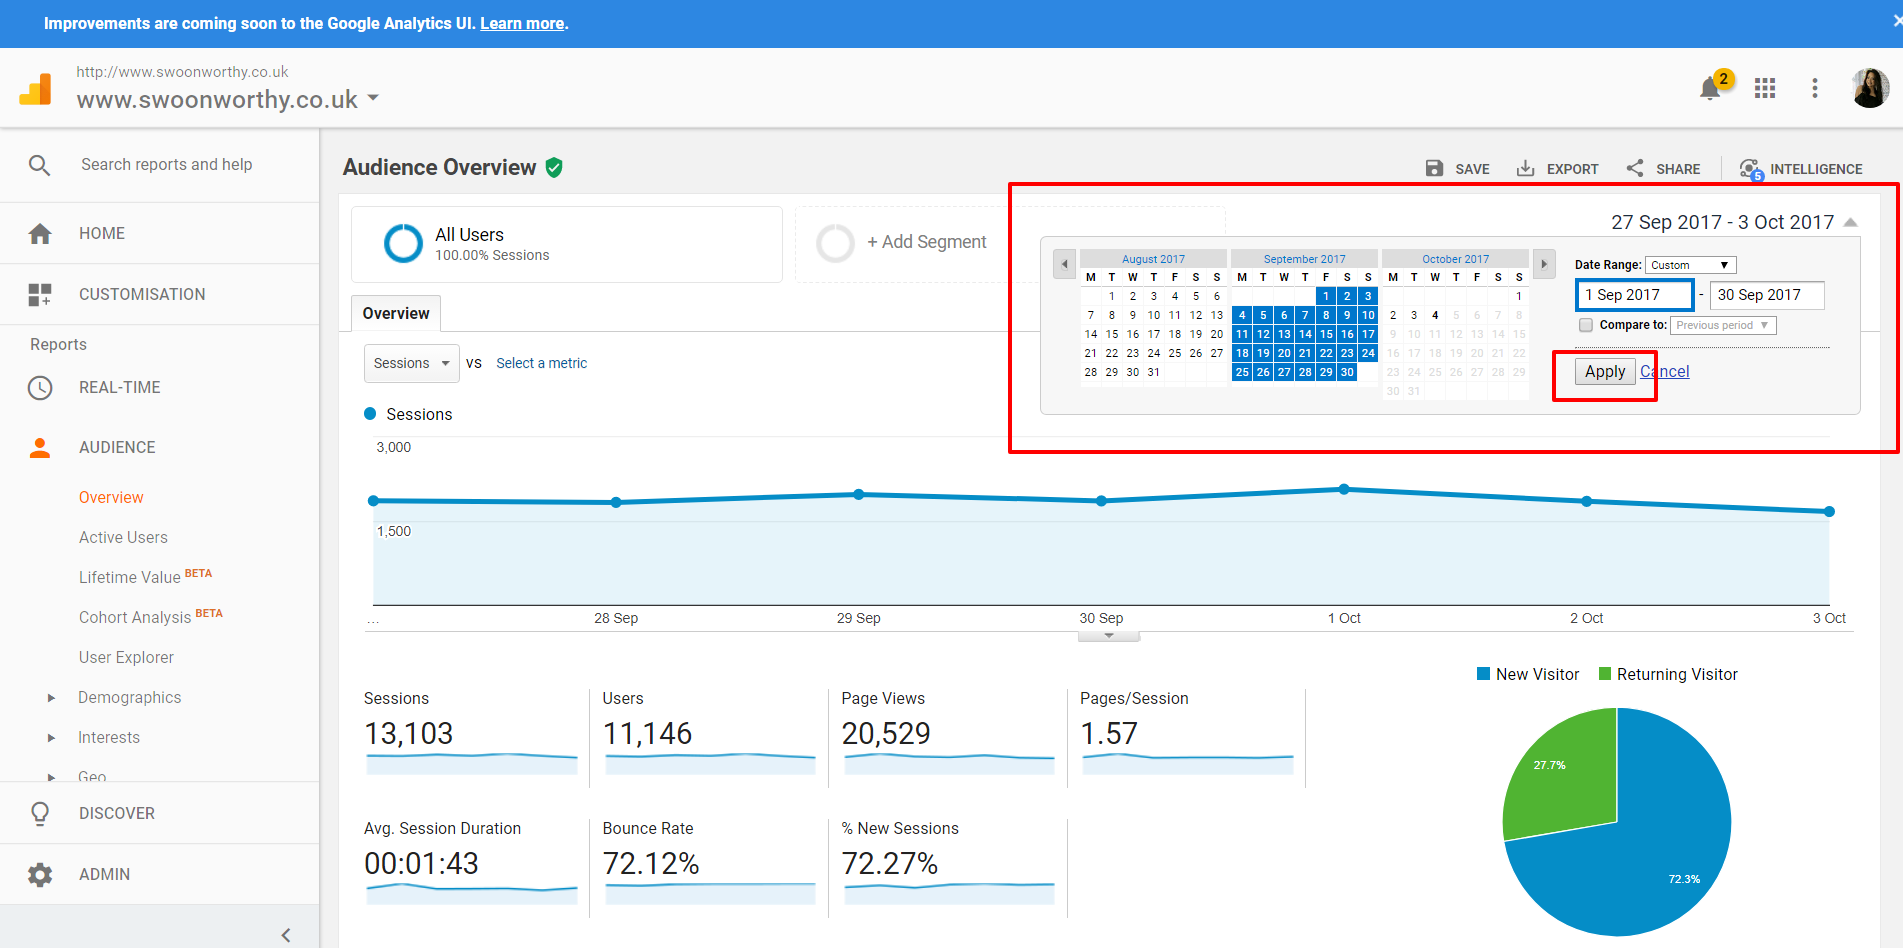
Change the dates to the previous month and click apply.
So now I can see exactly how many people have visited my blog over the course of a month. Now we’re going to look at the first line of numbers under the graph.
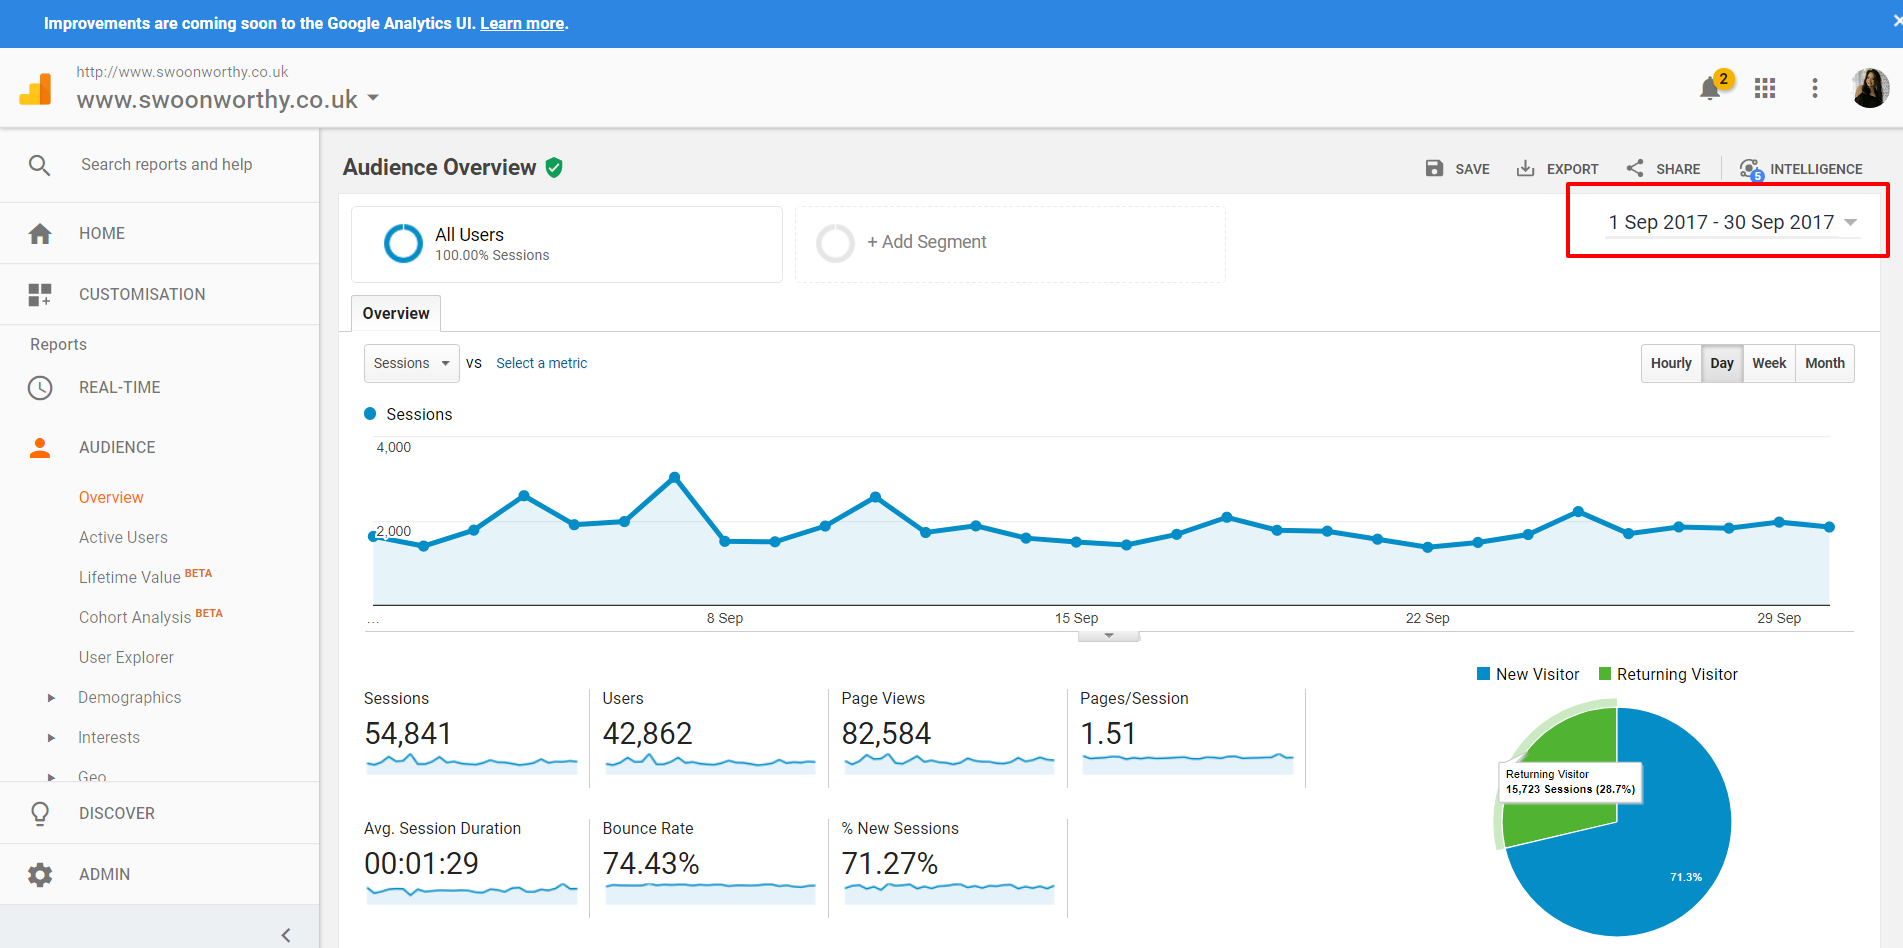
The first number is ‘Sessions’. This is basically the same thing as a visit. So one person may have gone onto my website and looked at 10 pages and then visited again later in the month and looked at one page – that would be counted as 2 sessions. Each individual visit is one session. This is less important than the other numbers so we’re not going to worry too much about this one for now.
The second numbers shown is ‘Users’. This is also sometimes referred to as ‘unique users’ or ‘unique visitors’. This means individual people looking at your website. So one person may have gone on my website and looked at 4 pages, then came back 2 days later and looked at 1 page and then came back 2 weeks later and looked at 10 pages. They’d still only count as 1 user. So that number will tell you how many individuals are looking at your site during a one-month period. This is important to track your growth.
The third number is ‘Page Views’. So each individual page within your website (whether that’s a blog post, your ‘about’ page, your contact page, your home page, etc) are all considered individual pages by GA. If one individual looks at 4 pages on one visit or 10 visits to your site, it would still be considered 4 page views. It’s an accumulation of all the pages all the individuals have looked at during the course of however many visits or sessions.
The last number is ‘Pages/Session’. This refers to the average number of pages that each individual (user) looks at when they visit your website. So if visitor number 1 looks at 2 pages and individual number 2 looks at 10 pages, the average between all those visits would be 5. On mine, for the last month, the average user looked at one and a half pages. Now, obviously you can’t look at half a page but it’s just an average so that’s why it’s not a whole number.
While they are all important numbers in the grand scheme of things, the two numbers that are most important are ‘Users’ and ‘Pageviews’. These are usually the metrics that PR Agencies or Brands will ask for before they work with you. The higher those figures are, the better.
Now that you know what those figures mean, you can start comparing time periods with one another. Have you seen growth the last month? Then go back into the time period and compare. In order to do this, click back on the dropdown next to the dates and click the box that says ‘Compare to Previous Period.’ Then click ‘Apply’.
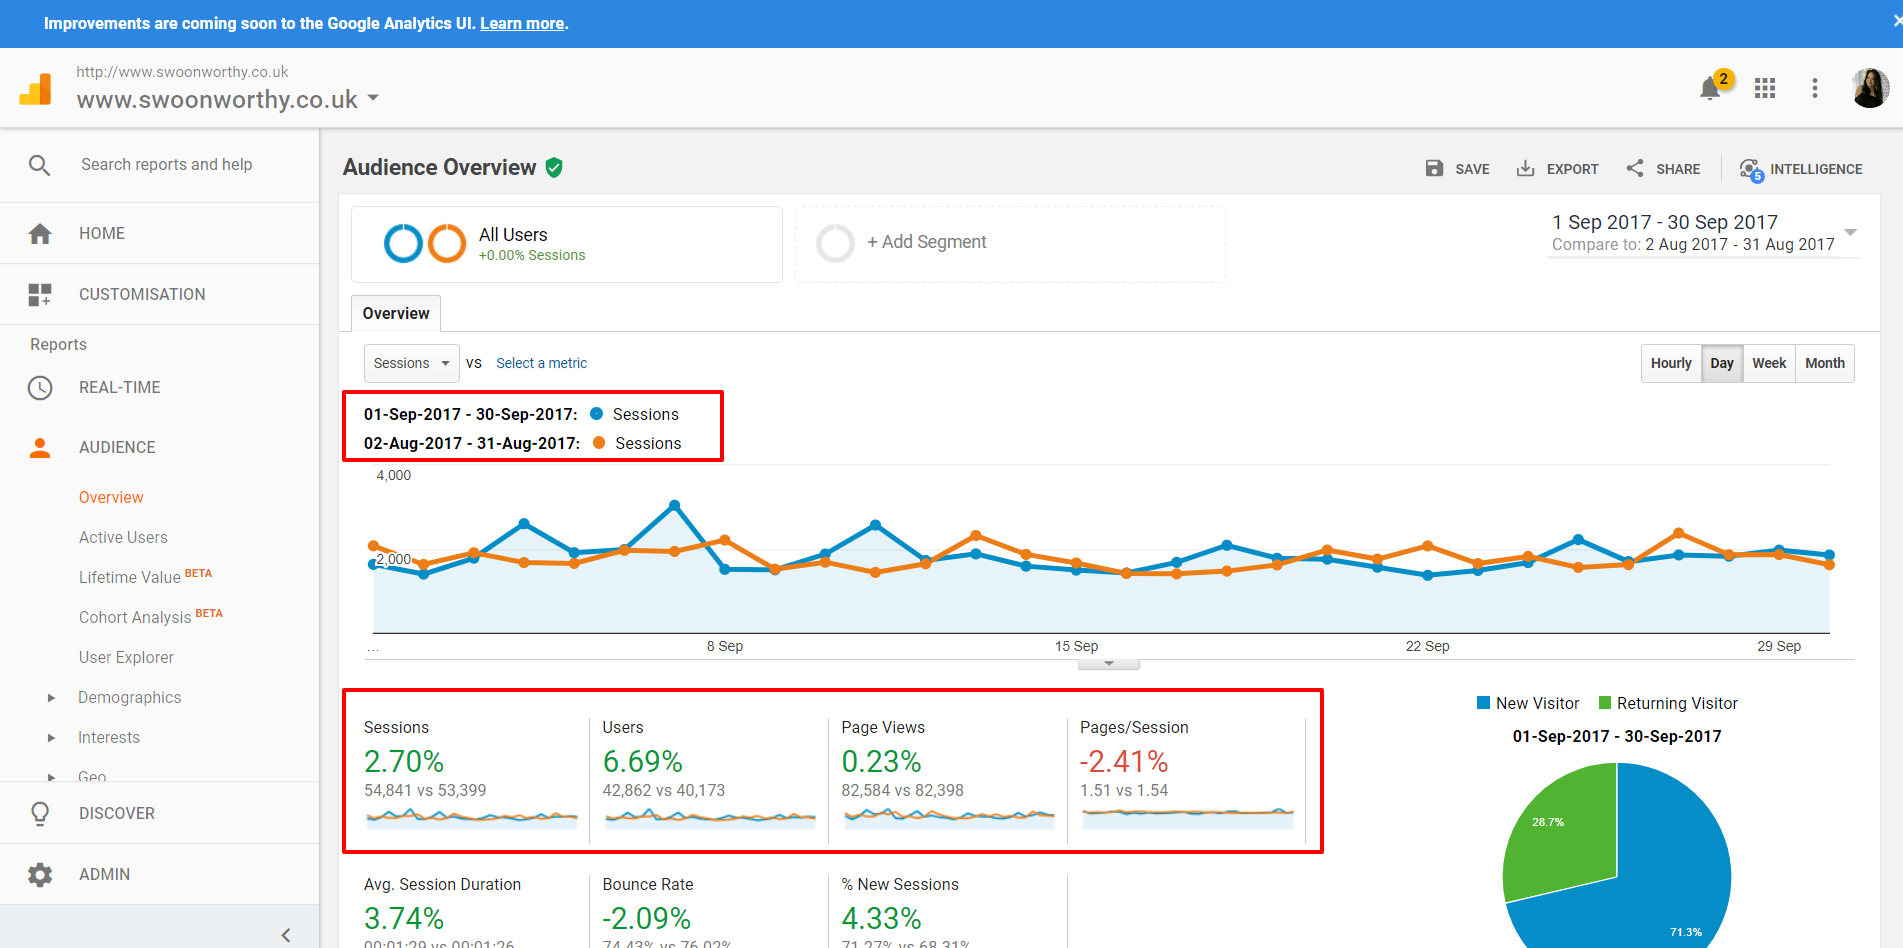
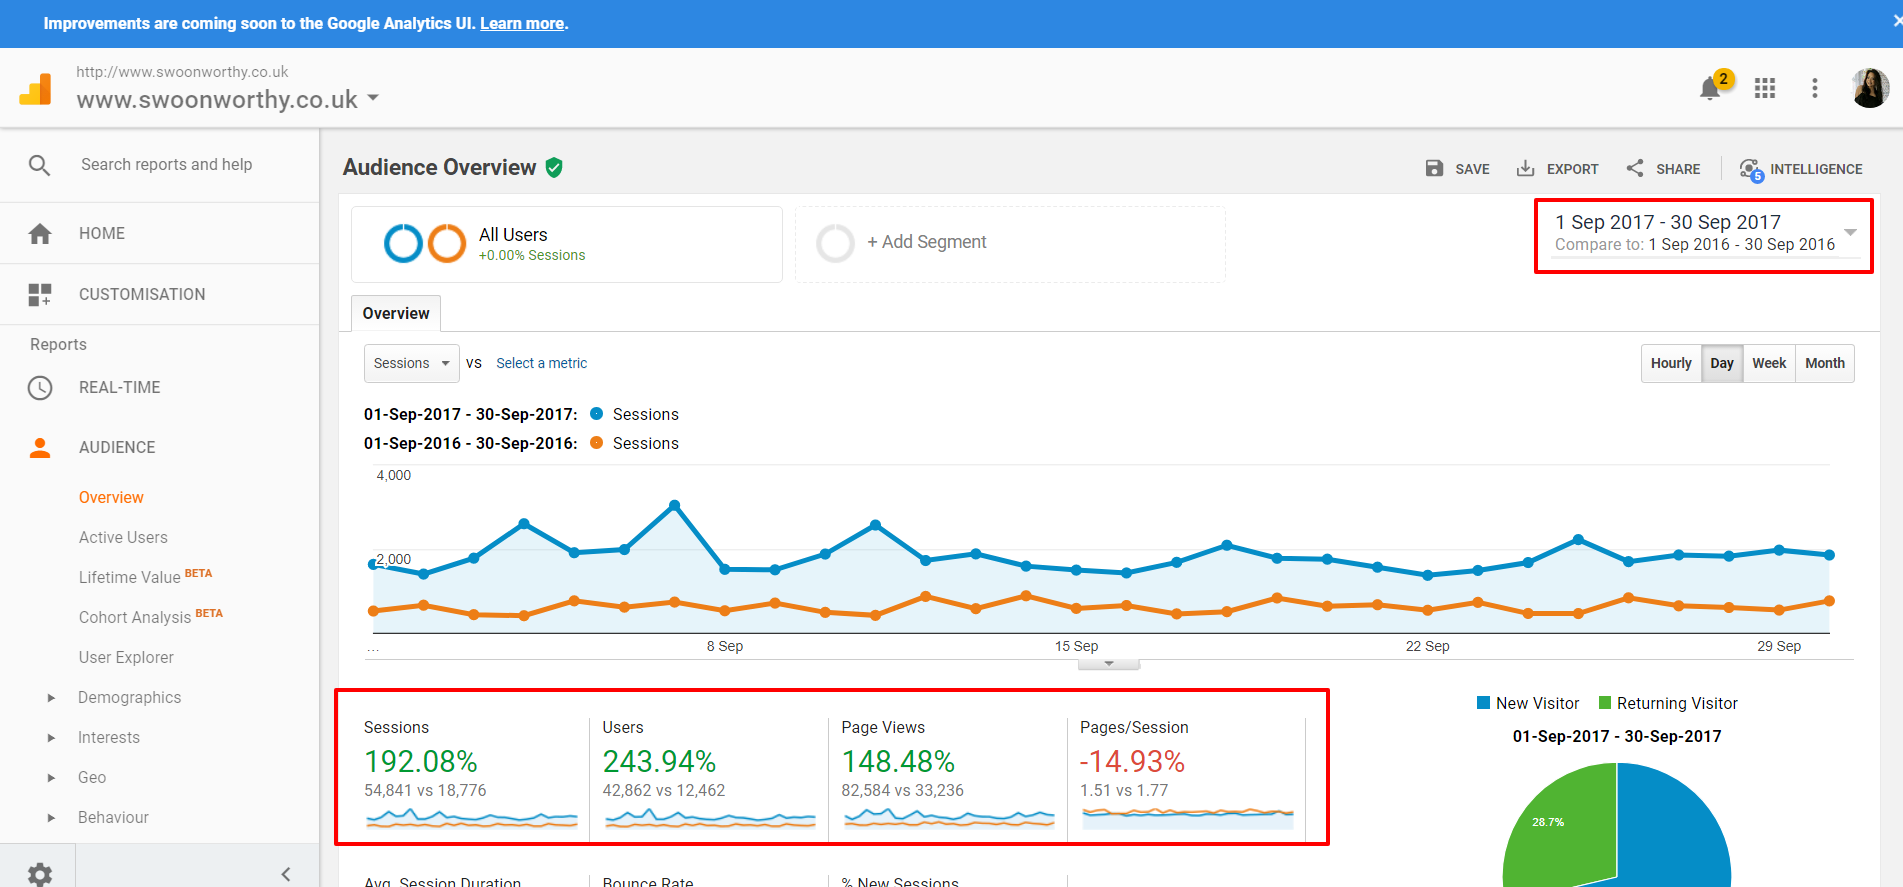
So I can see that compared to the previous month, my metrics are slightly up from August although my Pages/Session are slightly down. Overall, I’m fairly happy with this – your numbers will move up and down depending upon the month so small fluctuations are to be expected. Obviously, you want to see consistent growth over a longer time period so you can also compare longer periods or year-on-year comparisons just by changing the dates above.
Why is this important?
Remember me talking about only competing with yourself in my tips on beating the comparison game with other bloggers? This is a great way to do just that. My website has grown significantly from last year so that’s a reason for celebration. Of course, your numbers will look totally different to mine but be sure to concentrate on those things that show where your own success lies and pat yourself on the back for it!
You might also want to have a look at the pie chart on New vs Returning. It’s all a bit of a balancing act but keeping visitors coming back for more as well as attracting new visits is really important. So ideally, you want to see around a 50/50 split between them. For me, it really does vary month to month and some months, I’m closer to a 50/50 split (as you can see in the comparison with the previous year) but in the last month, I’ve had an influx of new visitors so that’s why my numbers skew more towards new than returning for September 2017.
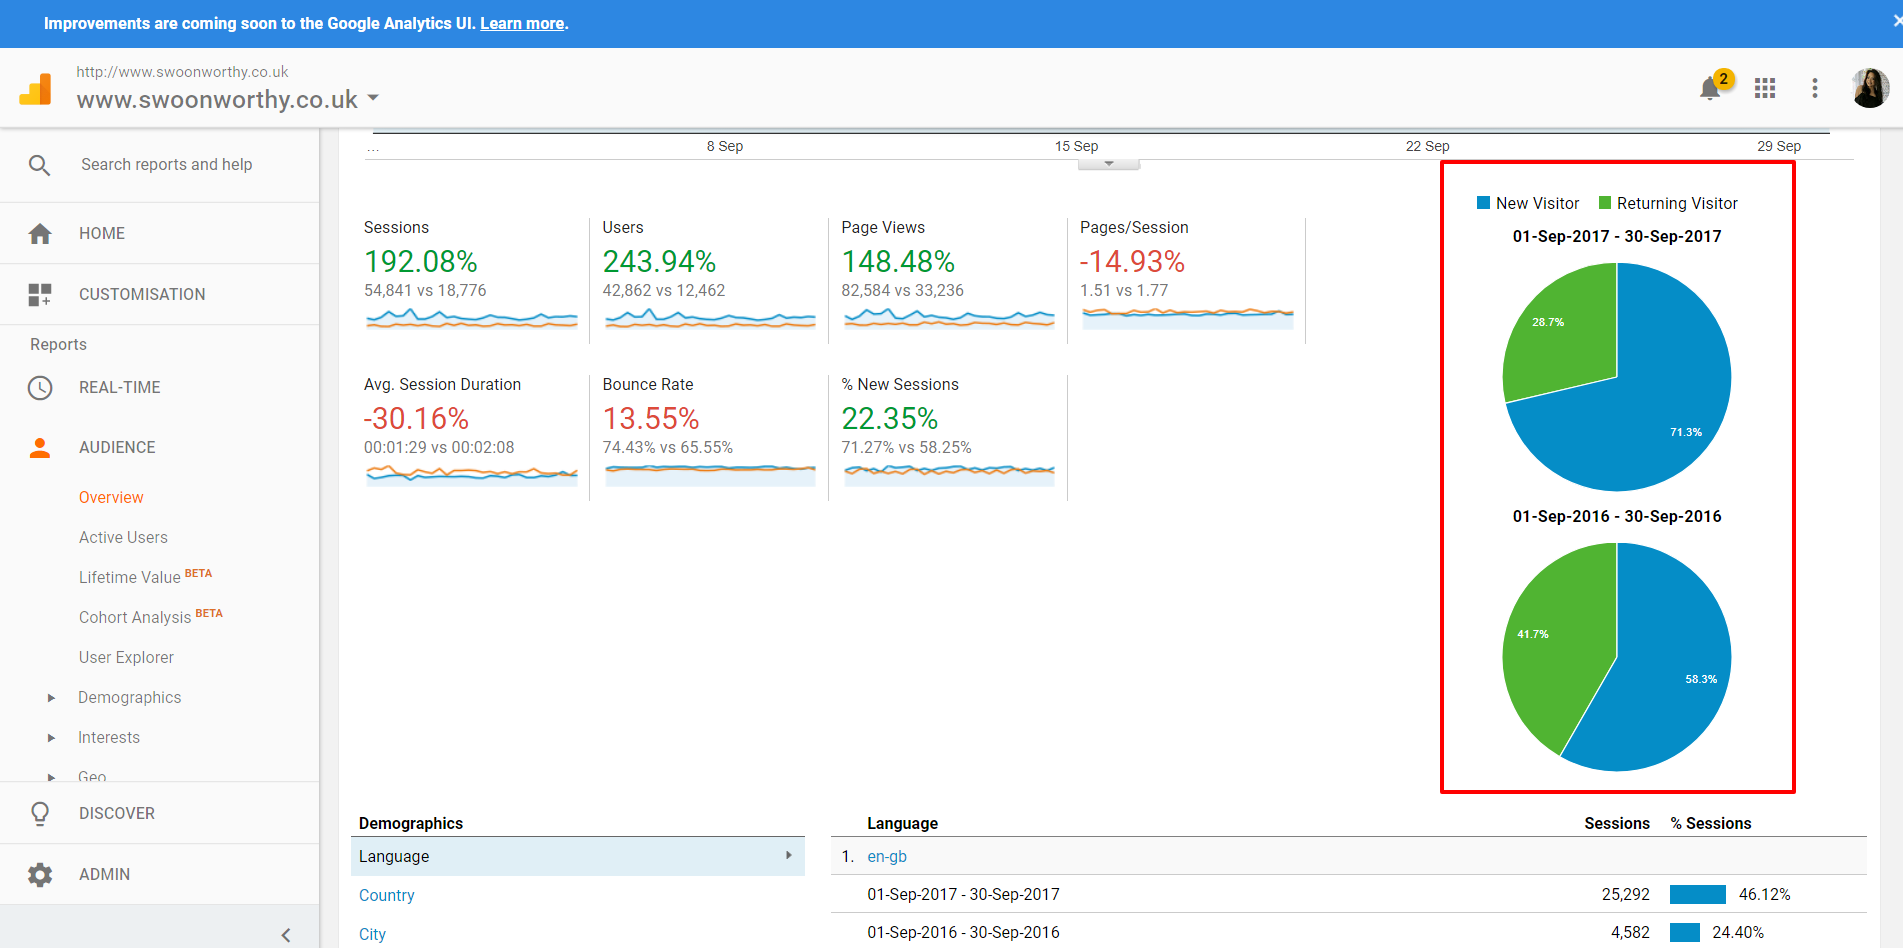
This is not a ‘bad’ thing per se (it’s great I’ve got lots of new visits!) but in the coming months, I’d like to see the number of returning visitors going up which means that the visitors who are coming in for the first time to my site are sticking around. What kinds of steps will make that happen? It’s worth thinking about what you’re currently doing and how you can engage your audience to keep them coming back for more. If you have a subscription option, this might be where you might want to attract people to stick around for a while and turn those one-off visits into repeat visitors.
Audience > Demographics > Overview
For the purposes of continuing our look through Google Analytics, I’m going to adjust my calendar once again to just show the current month and I’m going to go back to the sidebar and click as above.
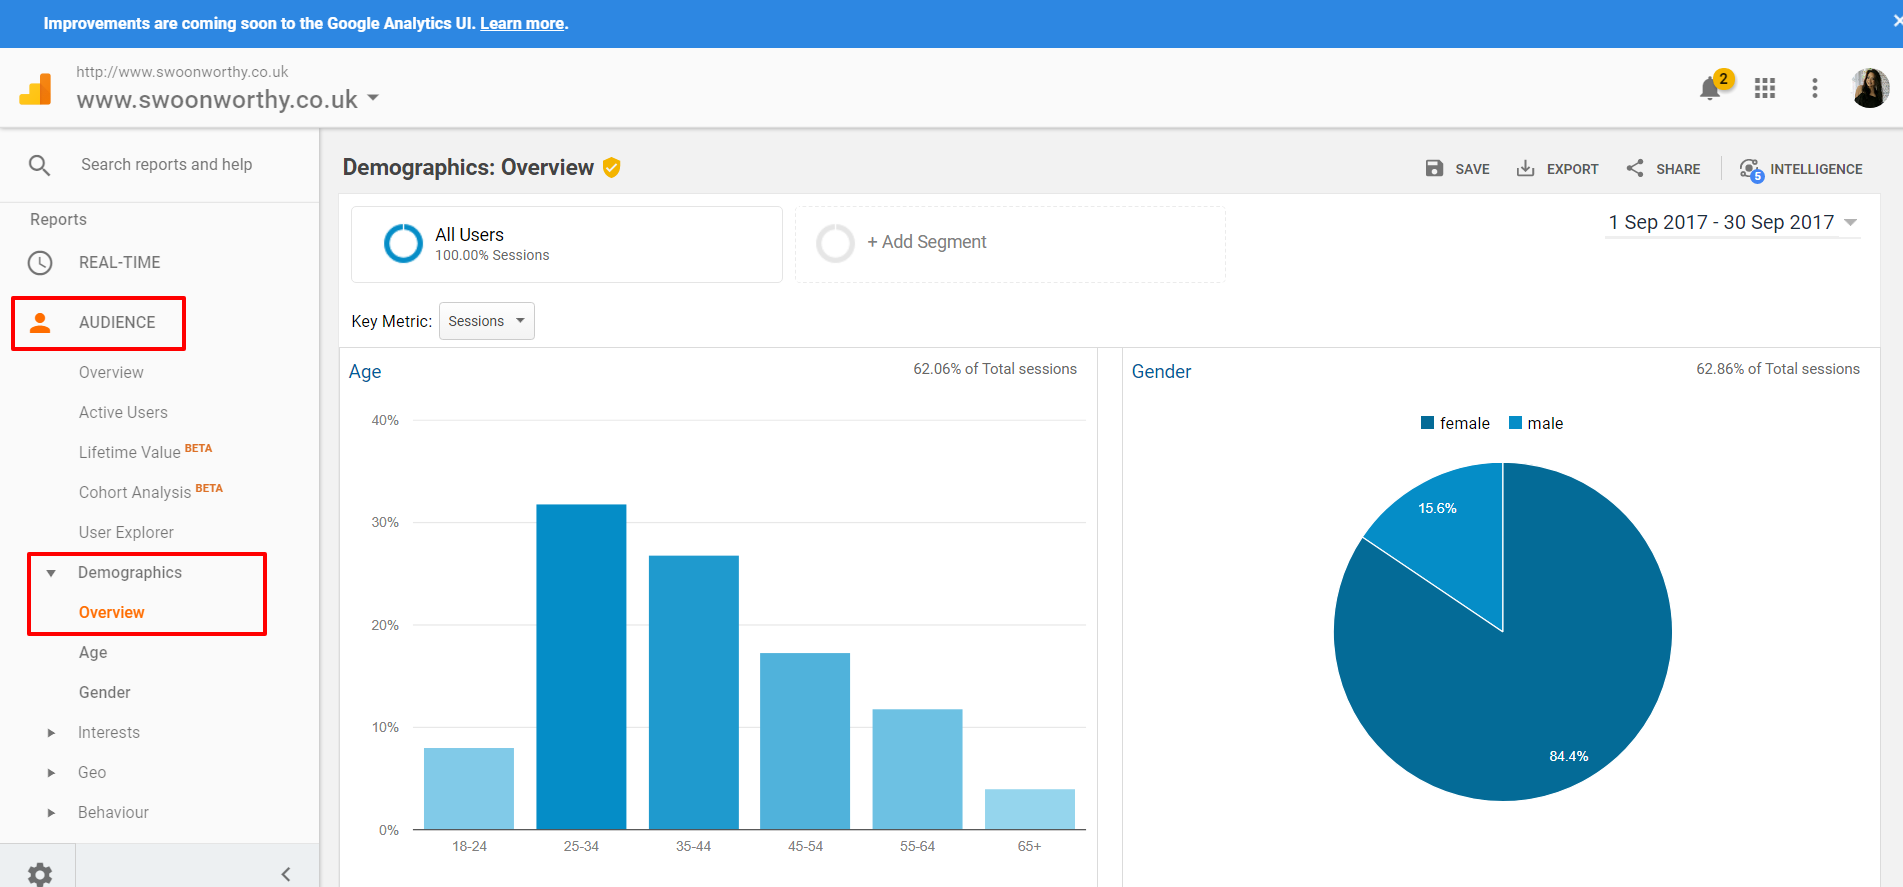
So now we’re going to look at who is actually visiting your website. You’ll always want to cater your content to your audience. If you don’t know who your audience is, it’s very difficult to do this as you’ll have no idea who you are ‘talking to’. And no, your target audience will never be ‘everyone’.
Why is this important?
Knowing who is visiting your website will help you to create content that’s pertinent to the audience you want to attract to your blog. So, for instance, my audience is 85% female and 3/4 of my audience is between the ages of 25-54. There’s little point in me creating content that is geared towards a much younger male demographic, for instance, as they aren’t the ones reading my blog. When I think about females in my demographic, I understand better what kinds of problems they might want to be solving and in turn, this informs the kind of content I create on my blog.
Aquisition > Overview
Now we’re going to go into the Acquisition portion of Google Analytics, moving from who your audience is to where they are coming from. It’s important to know where your audience is coming from before they come to your website. Did they Google a certain word or phrase? Did they see a mention on another website about you and follow the link? Have they come from a project you posted about on Facebook? Did they see an image pinned from your website on Pinterest? This is where you can find that out.
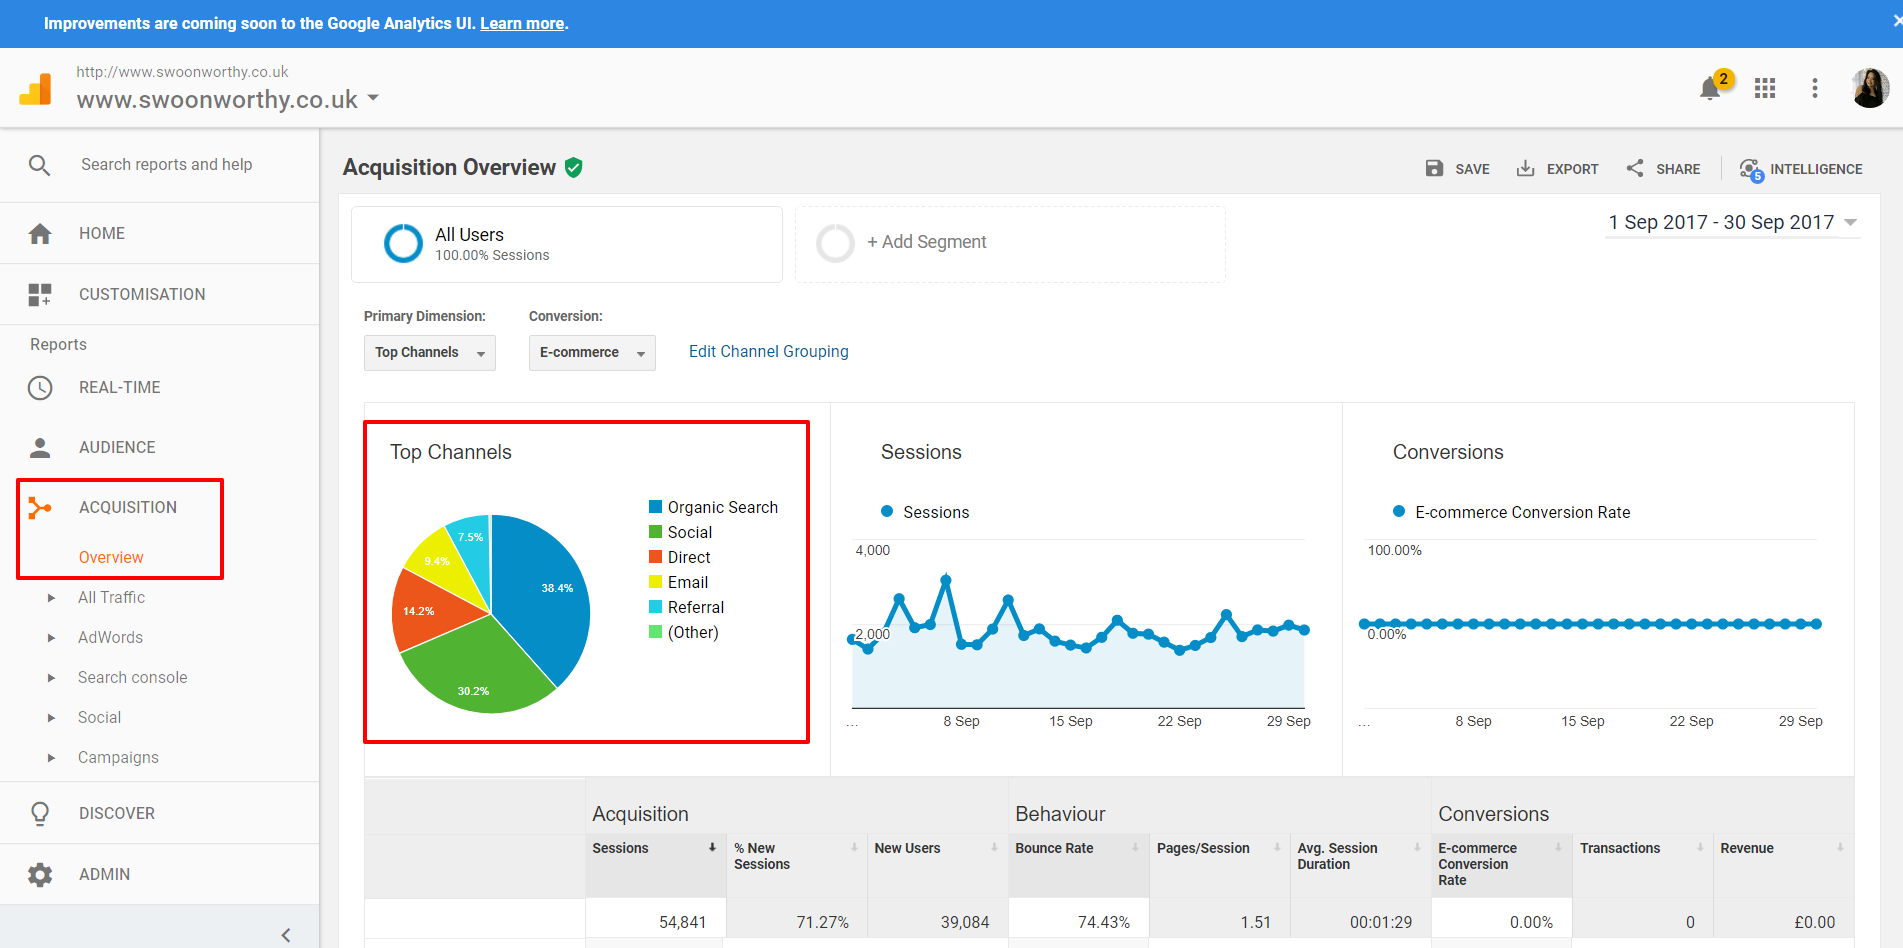
Why is this important?
Because if you know where your audience is (or isn’t!) coming from, then you know what you should be concentrating on. I normally have a look at the little pie chart on this page. I can see that Organic Search (that’s your search engines like Google) make up most of my traffic for the past month – nearly 40%. This is great as it means that efforts around SEO are working and people are finding me. (You can read more about getting to grips with SEO here!).
I can also see that my second biggest ‘referrer’ is Social at 30%. Now if I want to drill down and see which Social platforms are driving traffic, I can click into that here.
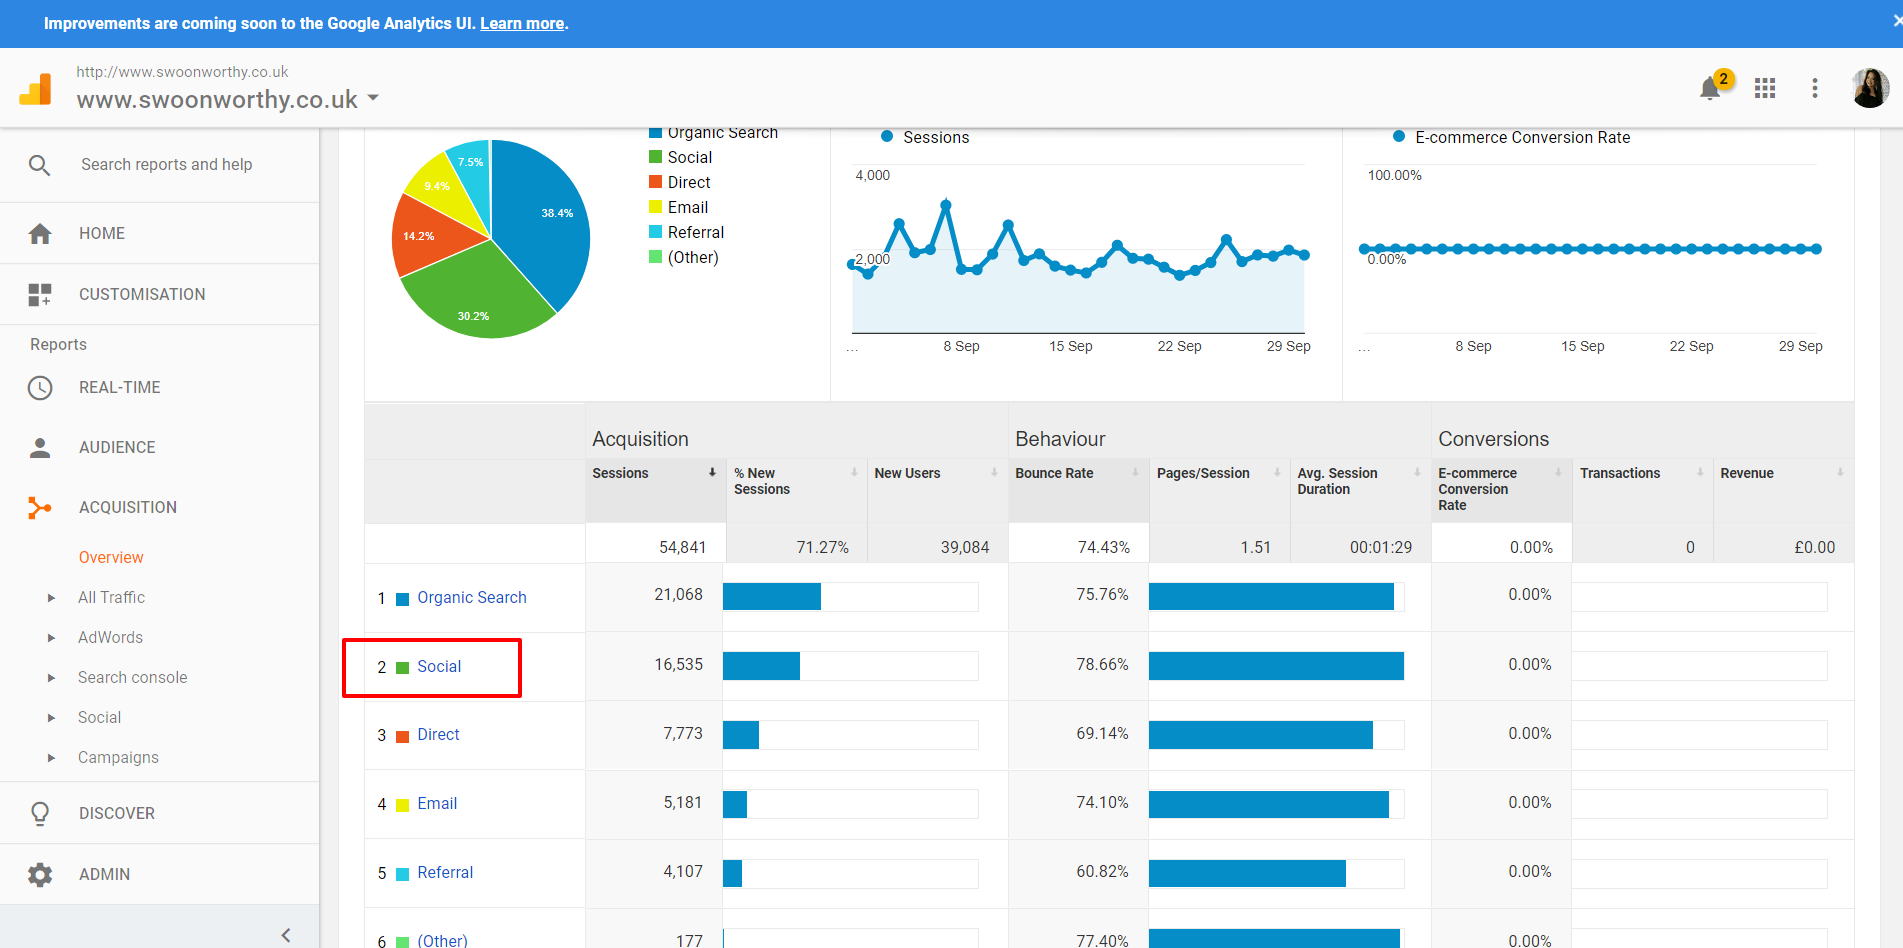
From here, I can see that Pinterest is my biggest traffic driver when it comes to Social by a long shot with around 84% of my social traffic coming from here. I did a post all around using Pinterest to drive traffic to my blog and I can see that what I’m doing is still working.
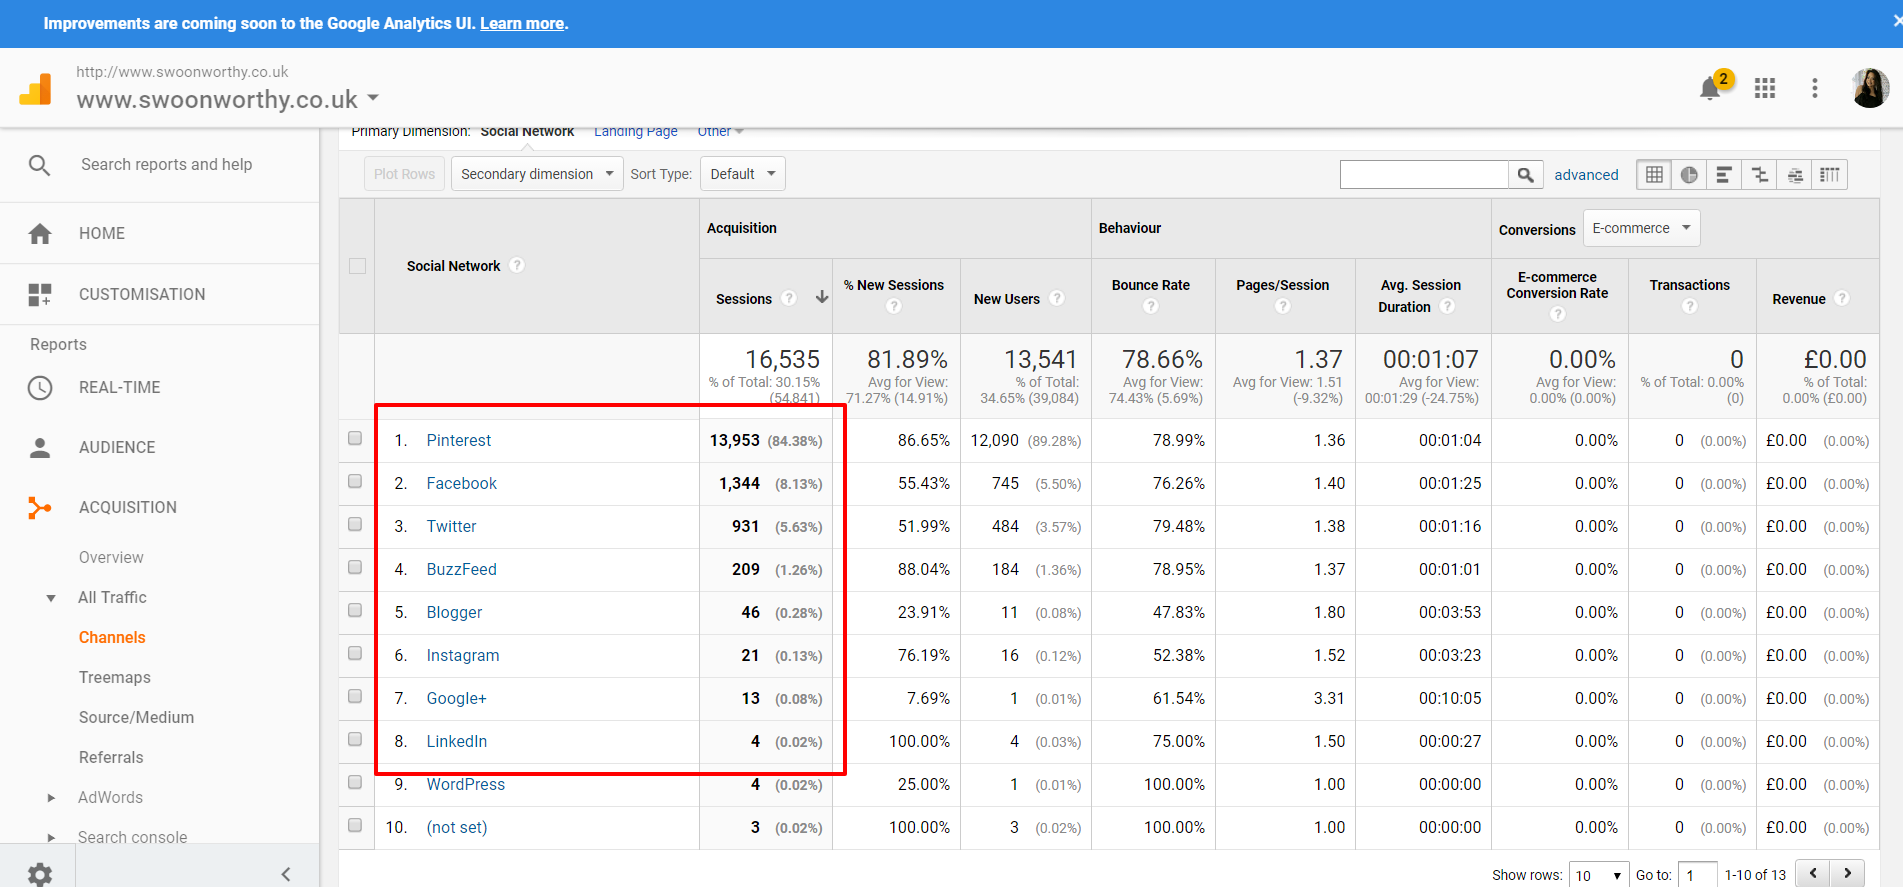
I’ve also changed the way I’m promoting posts on Twitter and Facebook so looking at this part of the Google Analytics will tell me what’s been working and if I’ve had any growth. How? By changing the calendar at the top of the page and comparing one month to another. If you are concentrating your efforts on a particular social platform, is it working for you? GA will tell you here.
Everything in blue shown below is a link so if you click through them you’ll see more detail.
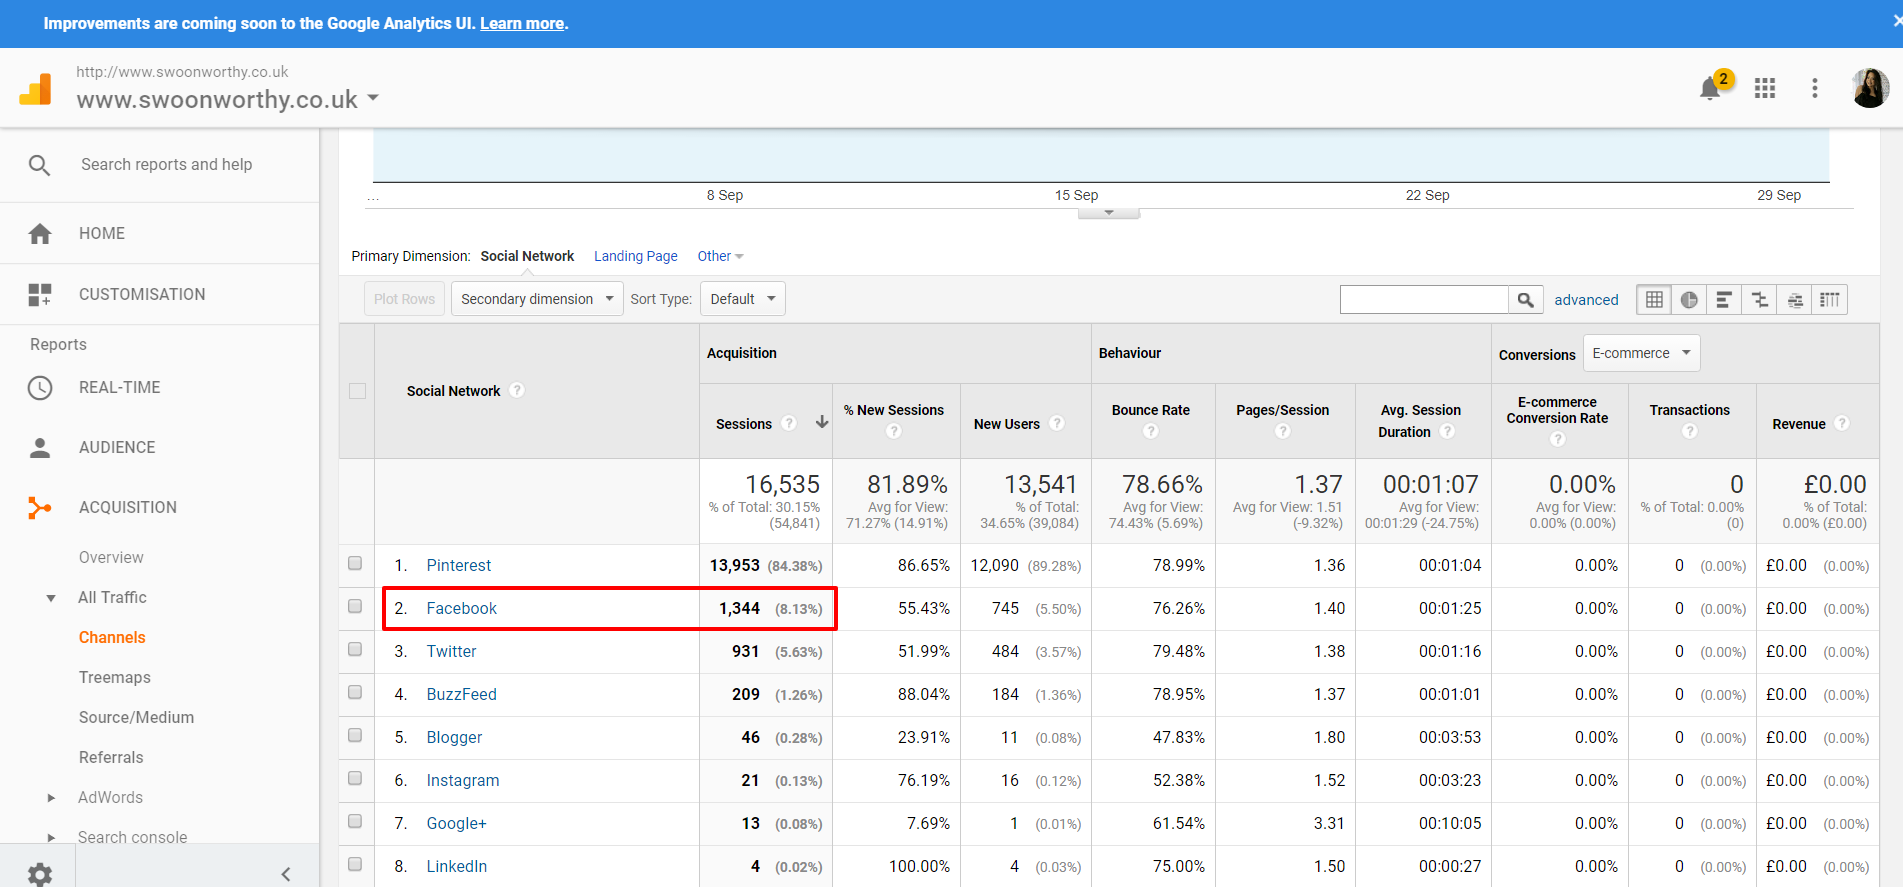
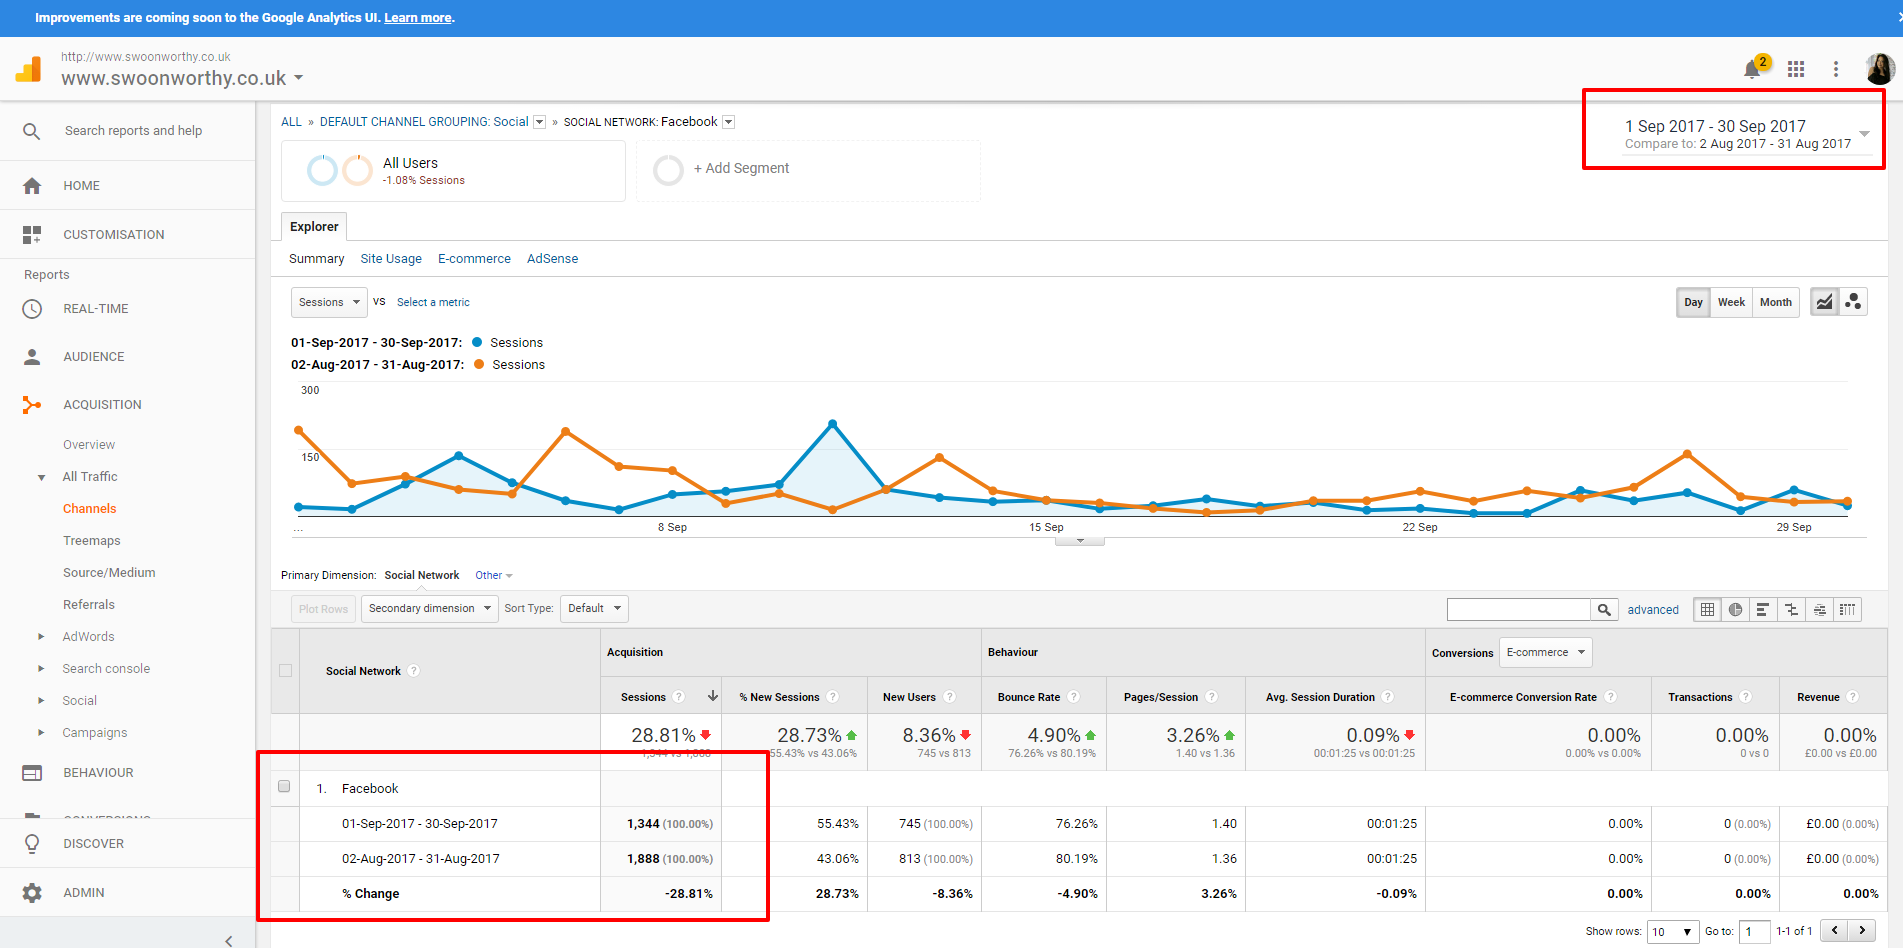
So for instance, I tried out posting more on Facebook in August and then stopped. I can see this has impacted my visits from Facebook by comparing the two periods (changing the calendar as shown above) by nearly 29%. So this will inform me of what impact more posts on Facebook will give me and whether it’s worth my time creating more content for Facebook.
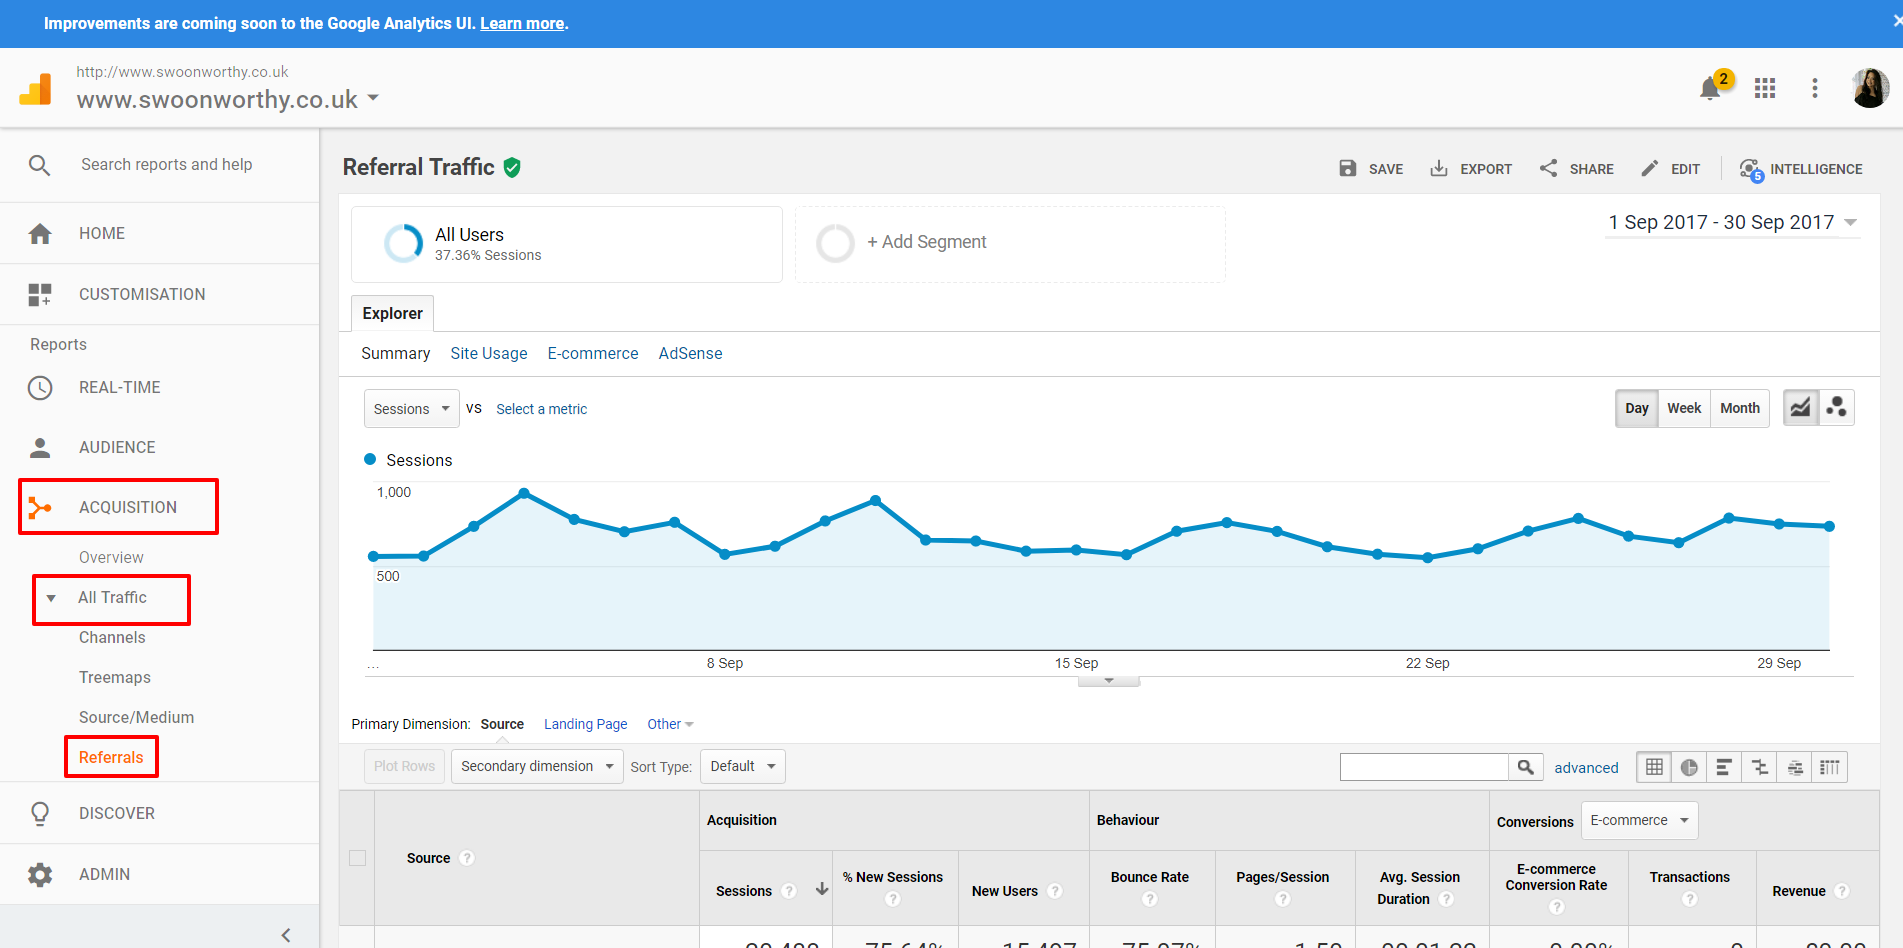
Aquisition > Overview > All Traffic > Referrals
Where else is traffic coming from other than social media and search engines? Well, this is where we’ll find out.
I also like drilling down into referrals. You’ll see social show up in here too but you’ll also see any websites that might be driving traffic your way.
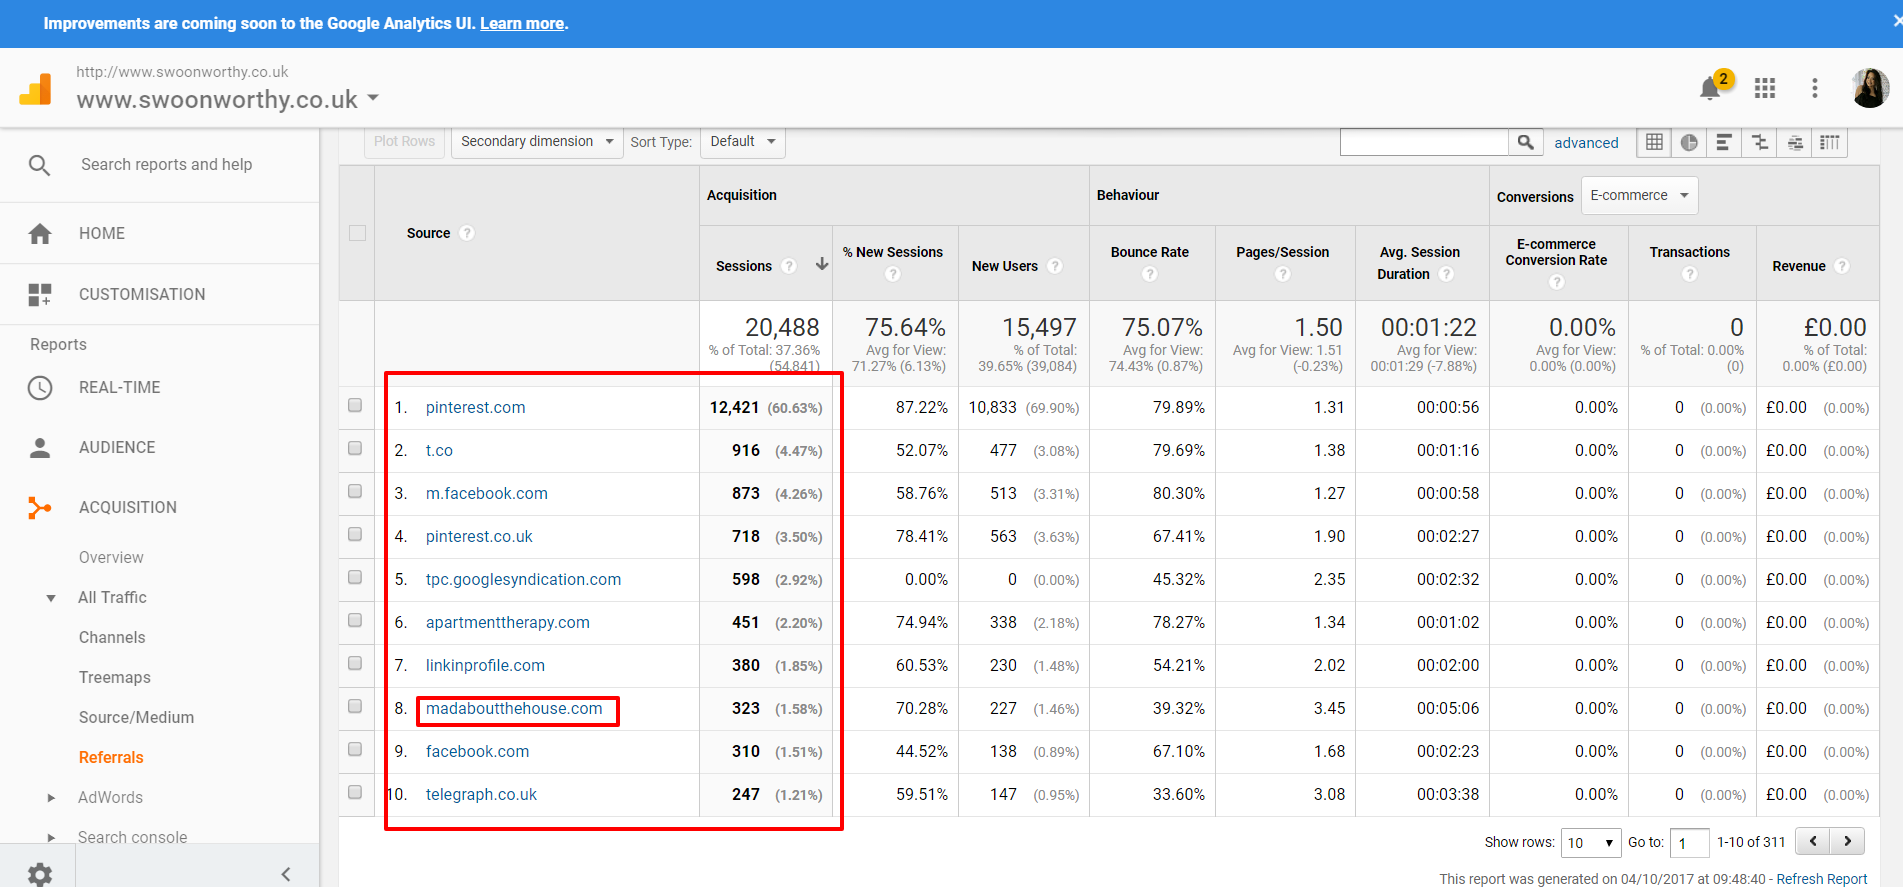
Over the last month, I did a guest blog post on Mad About the House and so that’s in the Top 10 Traffic Referrers for the month. You can actually see exactly where the original posts are if you click the little double box to the right of the link. The web page will then open in a new window.
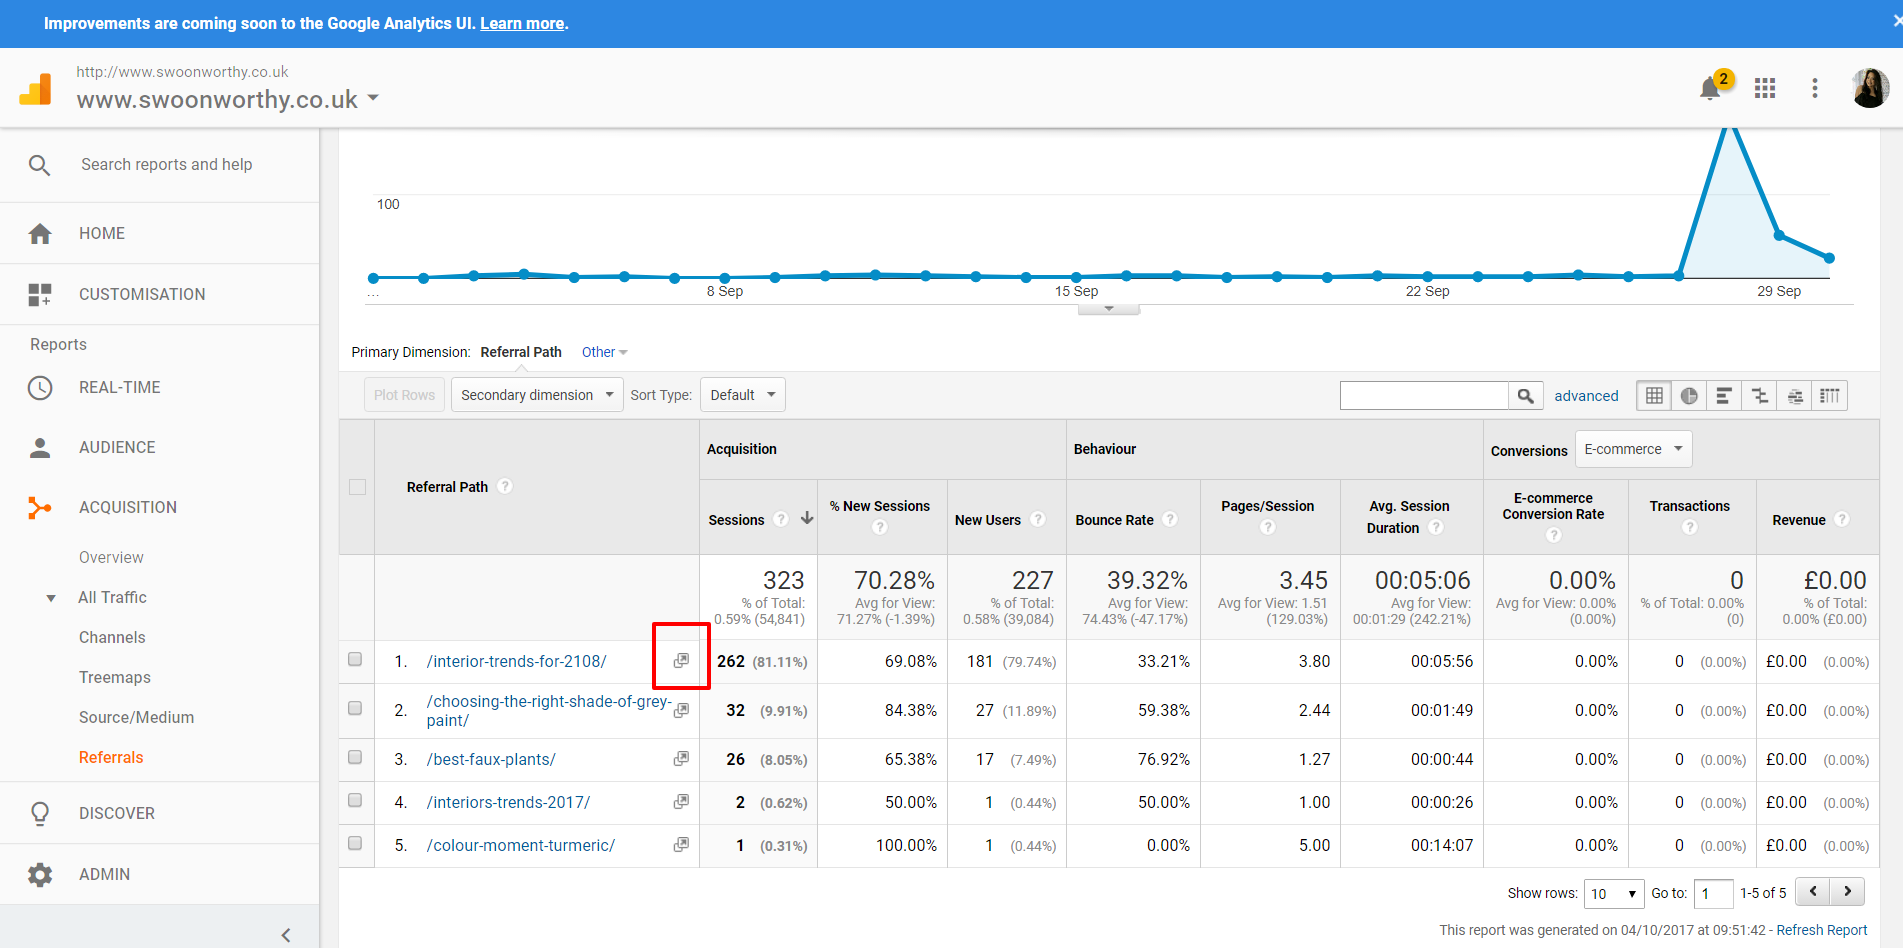
What else can I glean from this information? Well, I can see that on average, people who clicked over from Mad About the House stuck around for a while.
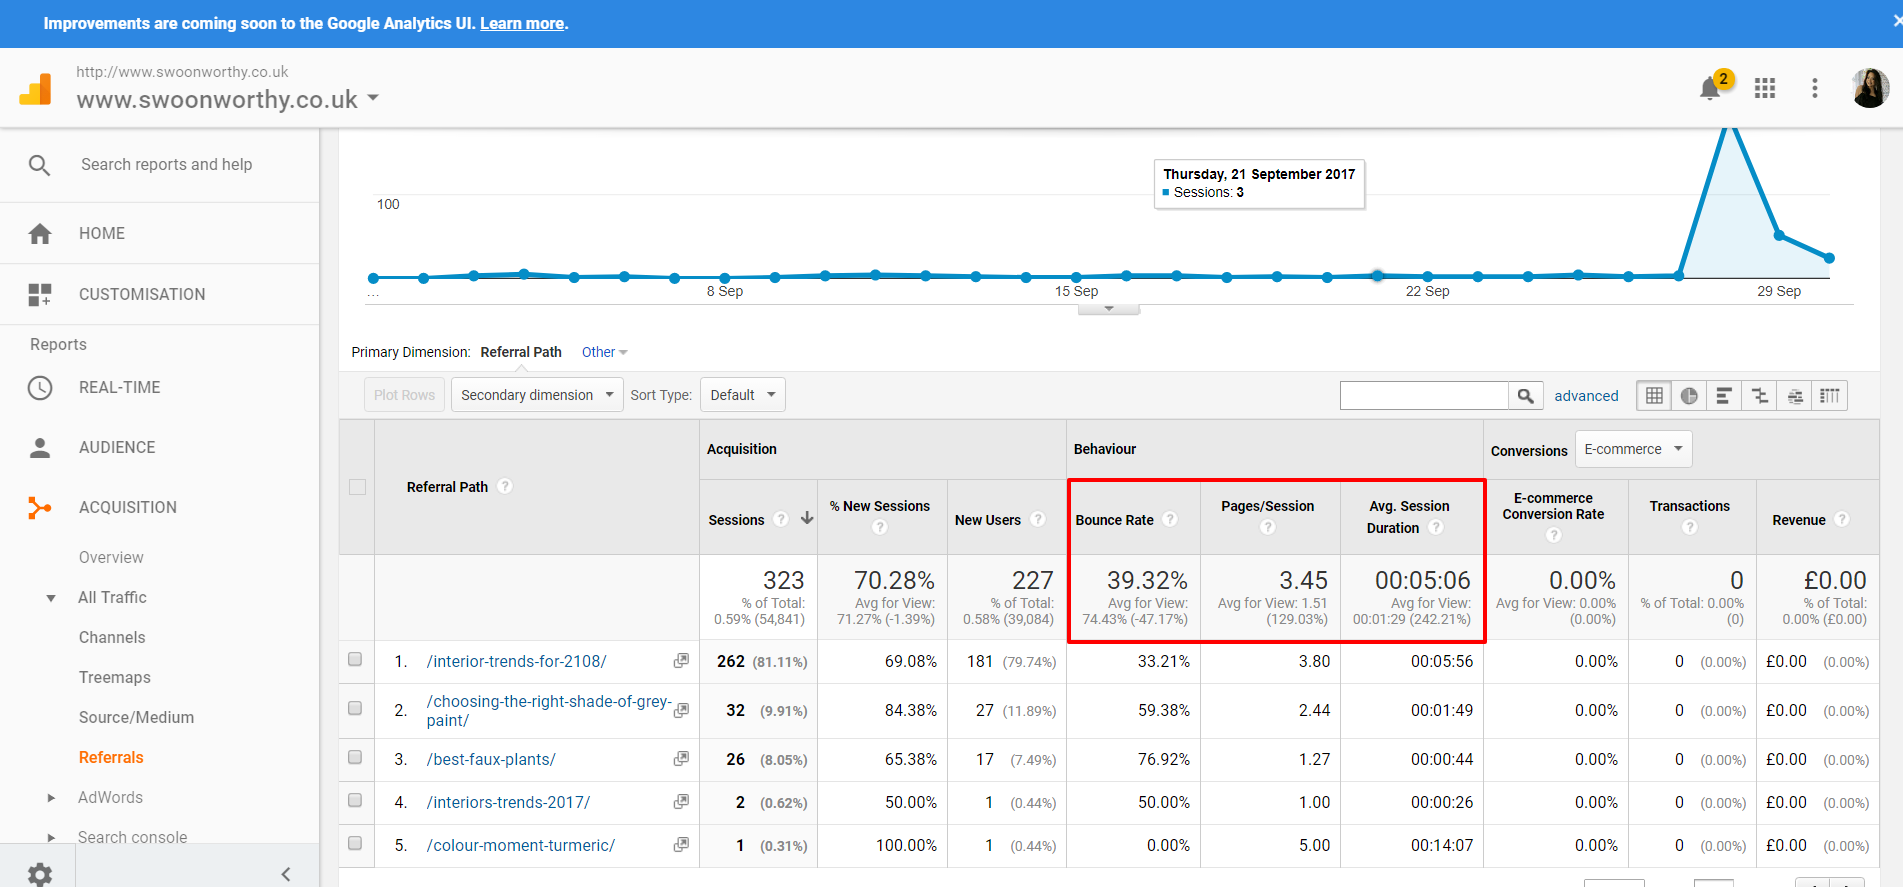
The bounce rate is just 39.32% (which is much lower than the average visitor at around 75%) and on average, they stayed on my blog for 5 minutes and 6 seconds – again much higher than normal. This tells me that Kate’s audience has a wide crossover with my own. They came over from her website and had a good look around on mine and looked at multiple pages too (3.45 on average). After looking at this information, I may then decide to approach Kate about doing further collaborations together so we can both benefit from audiences which clearly have a lot in common.
Why is this important?
Being featured on larger or similarly-sized blogs are a great way to build traffic to your website so you might consider offering to write a guest blog post or submitting your own projects to larger sites to be featured. Things like award nominations or getting on ‘Best of’ lists will also drive traffic so they are all worth going after if you can. Understanding what kinds of sites drive traffic to your own will allow you to concentrate on those that bring the biggest results.
Behaviour > Site Content > All Pages
Finally, we want to look at what kind of content your audience likes best. This is really important as a blogger so that you can create more of the content that your audience is looking for.

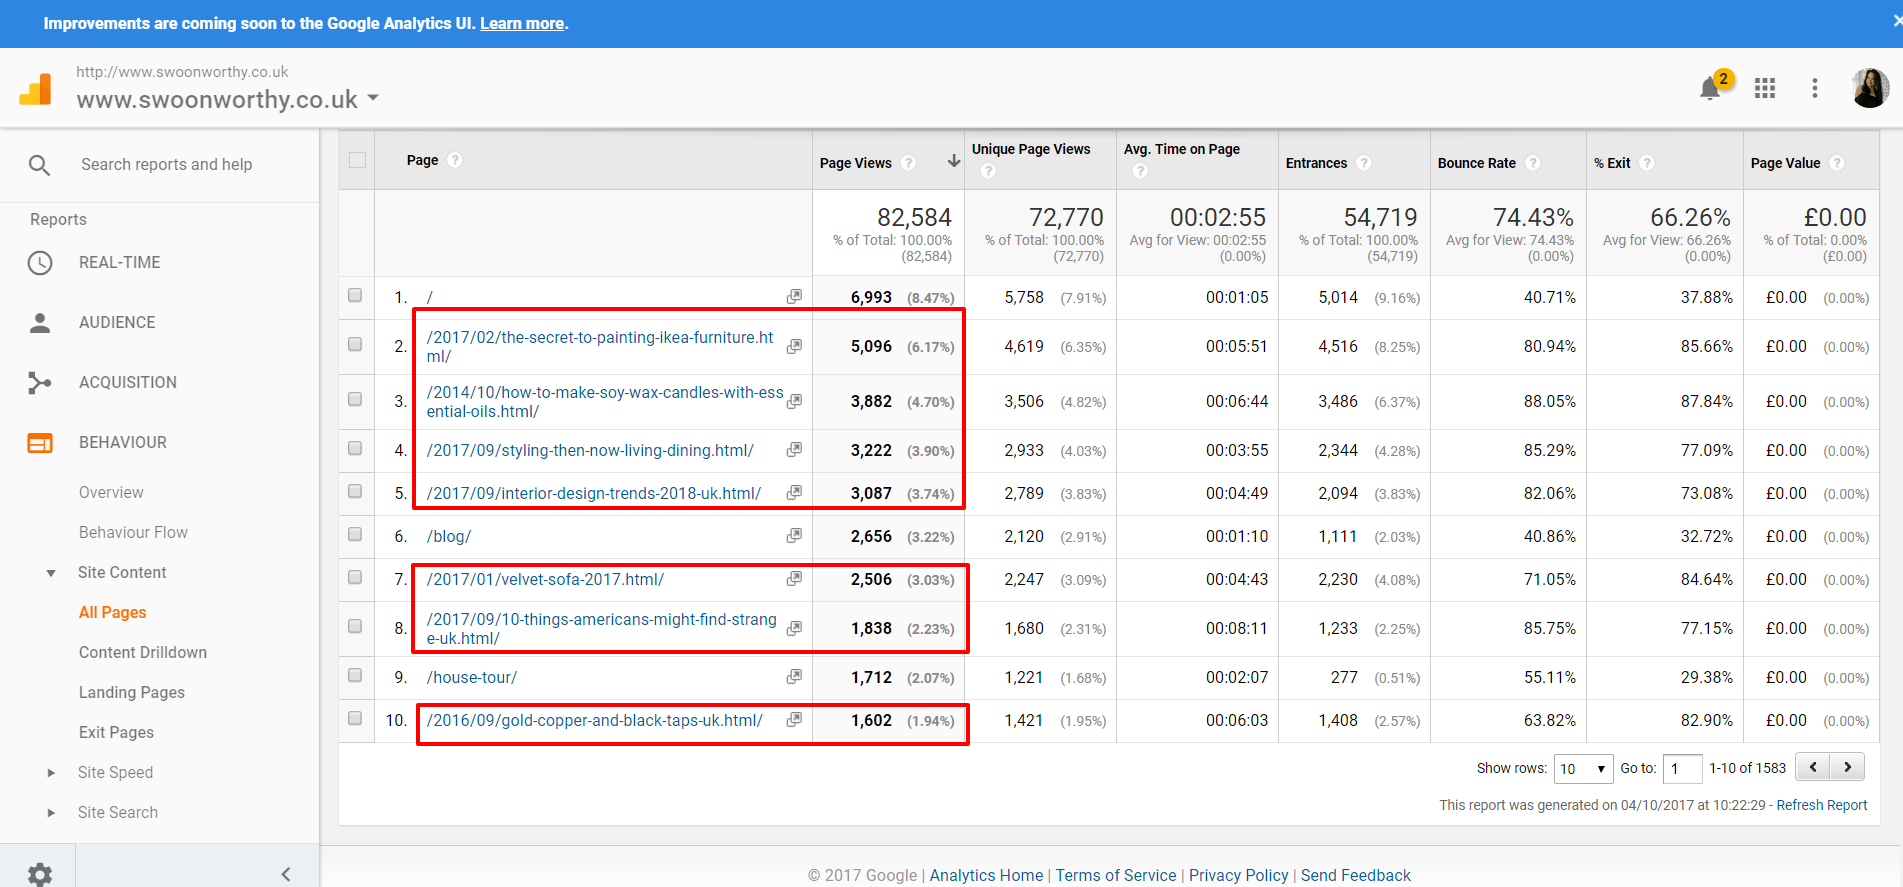
From here, you can see your most popular posts during the month. So for me, the post I did on Painting Ikea Furniture, an older post on Making Soy Wax Candles and my Before & After Styling post have all done well this month. So what does this tell me?
Why is this important?
From this, I might discern that my audience likes tips which help them save money (Ikea hacks and making your own candles are both budget options) as well as interior design advice and before and after posts. So when I’m deciding on content for my blog for the following month, I’ll use this knowledge to think of other blog posts I can write or shoot that give my readers more of what they already come to Swoon Worthy for.
Of course, there is a wealth more information available on Google Analytics but these 5 areas are what I tend to look at the most. How often should you be checking this information? It’s really up to you but having a quick look through from month to month (or at least every couple of months) will keep you abreast of what’s actually happening behind the scenes on your blog and the knowledge is there to be used to improve it!
So as you can see, Google Analytics looks horrendous and scary but I promise, it actually contains a wealth of information that gives you greater clarity about your blog, your audience and will inform your decisions on what to concentrate on for the future. I would love to know if you found this helpful or if there was anything about GA that you found difficult to use? Is there anything you learned today? Or is there something you use GA for that you love? Do share in the comments!


Awesome post Kimberly, so great to see a post about analytics and yes agreed, that glazed over look of fear when you mention anything to do with google analytics. I will be sure to read this in more detail later when I have time, I look forward to it!
Hope you are well and also, great job on the fashion photography post that was mentioned in your newsletter recently. It totally hooked me in and was a fascinating read. You looked absolutely fab and you portray so much elegance and confidence. Great job!
Laura :)
Aww thank you so much Laura! And I’m so pleased you enjoyed the fashion post, that means a lot to me :) xx
This is super helpful! I don’t look at my GA enough so will have a think after reading your post x
I never tried comparing data before the way you have mentioned, so I’m definitely going to be using that as a tool from now on – thank you! x
Oh my this was so helpful, I used Google Analytics a bit, but mainly relied on WordPress stats, which is good but not quite as detailed. I’ve gone through your steps and learnt so much, thank you! x
Great post – so easy to understand. Thank you.
Oh gosh, I don’t spend anything like as much time analysing my own stats as I should – I really need to go through your notes and properly apply everything! x
Woahhhh! Bookmarking this for reference at a later date. Thanks guru!
I love your blogging tips!! They are so useful. I’m absolutely useless when it comes to analytics. I know it’s something that I should pay more attention to but it seems to complicated. I’m bookmarking this for a quiet half hour when I can go through it properly with own stats.
Brilliant post Kimberly! I think because it’s my dayjob I forget how much of a need there is for this in the blogging community but you’ve nailed it! Other good measures can come in the Site Search data if they have it set up to see what visitors want/can’t find, or within Search Console to see where you can improve clikckthrough from organic x
Ahh thank you Karen – it actually means a lot to me when you comment on these ones as I know you are an expert when it comes to this stuff! You are absolutely right about Search and I was considering adding it into this post but it was already SO long I didn’t want to overwhelm people! Ha! But it’s a great one to mention so I’m pleased you did, thank you! :) xxx
This is such a good post and you’ve explained it so well. In fact you’ve done a better job than Google did at the course I went to the other week. I regularly check my analytics and find it really interesting. However, I’m rubbish at taking the info I find and acting on it. I simply do not know what to do with these insights.
I loved this post! I use GA but not as often as I should and it helps to know what the key areas I should be looking at are.
Thanks lovely :)
Claire x
http://www.thegreeneyedgirl.co.uk
Thanks so much Kimberly, I’m new to this and your post is really helpful. Straightforward and easy to understand.
What a useful post! Google Analytics can be a bit of a minefield to get your head around, so I think this will prove an excellent guide for lots of people.
Wow Kimberly, this is fantastic! I run a business selling farming machinery (so not a blog at all) but almost all of the points in your article are incredibly relevant and useful. Your sharing nature is incredible, so thank you!
p.s. also loving your lifestyle posts…!
I’m such a data geek!! This makes me want to launch a blog just so I can play with Google Analytics. haha!!
Seriously, I’ve been toying with the idea of starting a tastemaker’s blog showcasing my favorite places in New England, and once I manage to launch this site, your blogging advice will be the paramount in my success. I’ll send you the link if I can produce content I’m proud of!!
Hi Kimberly great post xxx
This is a great post – so informative! I just opened my Google Analytics and went through all the steps along with your post – thank you!! xx
Hi, I’ve just read this from Bloglovin, it’s so interesting. Thanks for taking the time to do this it was something I was never very sure of. I’ve saved the page to have a further read & am planning on comparing sept with October at the end of this month.
Such a brilliant post Kimberly. I’ve been avoiding Google Analytics like the plague as it just looks so complicated! Can’t wait to put these tips into practice – hopefully I’ll learn something in the process! 😘 xx
| http://www.jessicarhoades.co.uk |
Thank you so much Kimberly. I’ve done courses in this stuff that still left me scratching my head. You’ve made it actually useable. :)
This was so interesting and educational to read! Thank you so much for sharing. I have devoured the info and have a much better understanding x
Hi Kimberly
Sorry I never commented before but I thought your article was very well done and very clear so thank you.
I kind of keep an eye on them on a regular basis but I probably drilled down enough to be honest so I will from now on and I’m now off to read your other posts on SEO etc
Have a lovely Sunday
Ahh thanks so much Karine! I’m pleased you found it helpful and appreciate you taking the time to comment ;) Hope the other tips are helpful too! xx
Aah this is beyond helpful – thank you!! I thought I was already using GA… But it was just WordPress’ basic stats lol – lots to learn! I’m excited to get to know it better; it looks like it can be really insightful & help you get to know your readers better, which is exciting when you’re just starting out & feel a bit like you’re talking to no-one! Rx
This is great Kimberly. Good to get a refresh of how to look at stats